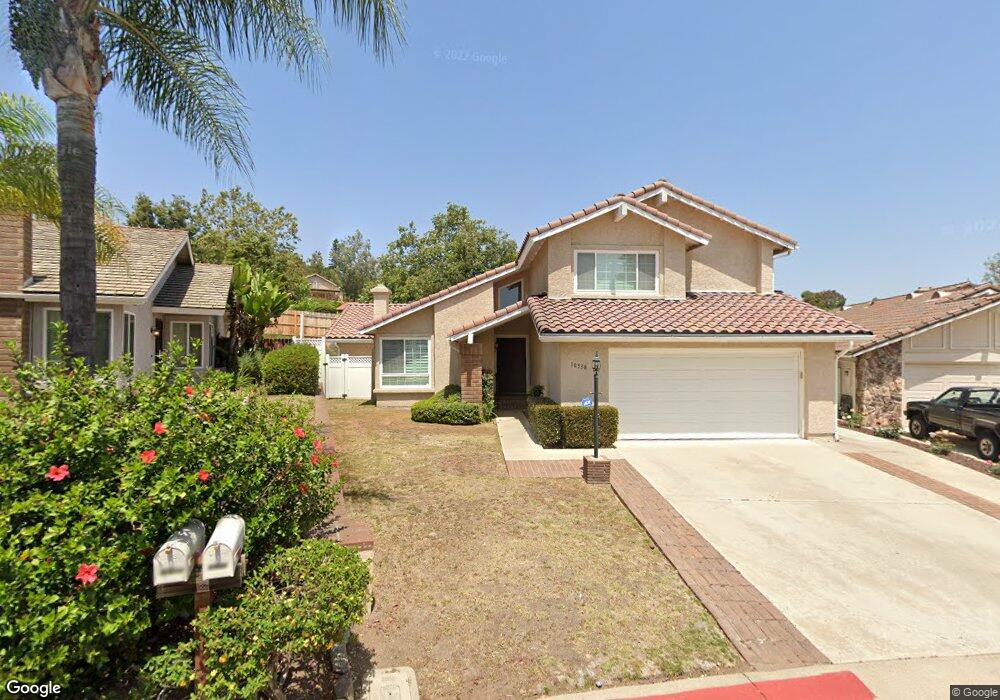
10538 Pine Grove St Spring Valley, CA 91978
Estimated Value: $836,000 - $960,000
5
Beds
4
Baths
2,711
Sq Ft
$339/Sq Ft
Est. Value
About This Home
This home is located at 10538 Pine Grove St, Spring Valley, CA 91978 and is currently estimated at $919,939, approximately $339 per square foot. 10538 Pine Grove St is a home located in San Diego County with nearby schools including Loma Elementary School, Spring Valley Middle School, and Monte Vista High School.
Ownership History
Date
Name
Owned For
Owner Type
Purchase Details
Closed on
Nov 18, 1999
Sold by
Ching Joaquin M and Ching Rebecca D
Bought by
Ching Joaquin M and Ching Rebecca D
Current Estimated Value
Create a Home Valuation Report for This Property
The Home Valuation Report is an in-depth analysis detailing your home's value as well as a comparison with similar homes in the area
Home Values in the Area
Average Home Value in this Area
Purchase History
| Date | Buyer | Sale Price | Title Company |
|---|---|---|---|
| Ching Joaquin M | -- | -- |
Source: Public Records
Tax History
| Year | Tax Paid | Tax Assessment Tax Assessment Total Assessment is a certain percentage of the fair market value that is determined by local assessors to be the total taxable value of land and additions on the property. | Land | Improvement |
|---|---|---|---|---|
| 2025 | $3,651 | $263,559 | $67,921 | $195,638 |
| 2024 | $3,651 | $258,392 | $66,590 | $191,802 |
| 2023 | $3,531 | $253,327 | $65,285 | $188,042 |
| 2022 | $3,465 | $248,360 | $64,005 | $184,355 |
| 2021 | $3,433 | $243,491 | $62,750 | $180,741 |
| 2020 | $3,292 | $240,995 | $62,107 | $178,888 |
| 2019 | $3,241 | $236,271 | $60,890 | $175,381 |
| 2018 | $3,133 | $231,640 | $59,697 | $171,943 |
| 2017 | $832 | $227,099 | $58,527 | $168,572 |
| 2016 | $2,930 | $222,647 | $57,380 | $165,267 |
| 2015 | $2,905 | $219,304 | $56,519 | $162,785 |
| 2014 | $2,853 | $215,009 | $55,412 | $159,597 |
Source: Public Records
Map
Nearby Homes
- 3065 Charwood Ct
- 3067 Charwood Ct
- 3037 Chipwood Ct
- 3003 Blue Oak Ct
- 2910 Elm Tree Ct
- 2930 Anawood Way
- 2946 Alanwood Ct
- 2962 Alanwood Ct
- 10770 Jamacha Blvd Unit 104
- 10770 Jamacha Blvd Unit 74
- 10865 Charing Cross Rd
- 3331 Eton Greens Ct
- 10620 Garden Way
- 10707 Jamacha Blvd Unit 24
- 10707 Jamacha Blvd Unit SPC 233
- 10707 Jamacha Blvd Unit 72
- 10707 Jamacha Blvd Unit 161
- 10767 Jamacha Blvd Unit SPC 119
- 10767 Jamacha Blvd Unit SPC 62
- 10767 Jamacha Blvd Unit 168
- 10536 Pine Grove St
- 10540 Pine Grove St
- 10530 Pine Grove St
- 10542 Pine Grove St
- 10537 Pine Grove St
- 10531 Pine Grove St
- 10526 Pine Grove St
- 10544 Pine Grove St
- 10527 Pine Grove St
- 10571 Moorpark St
- 10564 Moorpark St
- 3003 Villa Adolee
- 10597 Villa Bonita Unit 1
- 10591 Villa Bonita
- 10518 Pine Grove St
- 10523 Pine Grove St
- 3007 Villa Adolee
- 10585 Villa Bonita
- 10567 Moorpark St
- 10544 Moorpark St
Your Personal Tour Guide
Ask me questions while you tour the home.