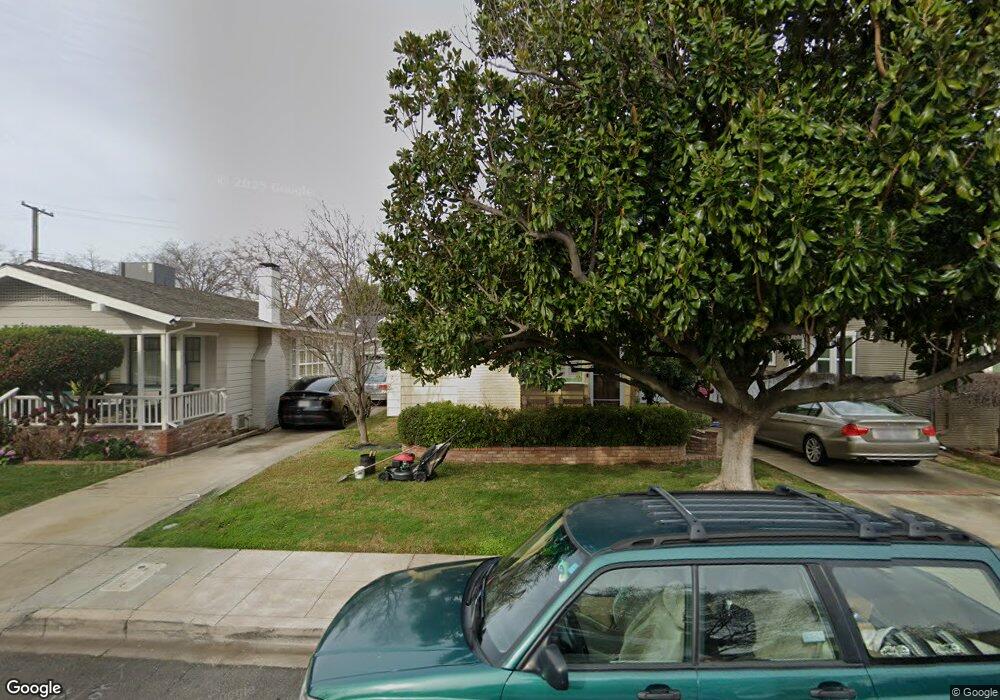
1054 Santa Ynez Way Sacramento, CA 95816
East Sacramento NeighborhoodEstimated Value: $585,843 - $694,000
2
Beds
1
Bath
1,164
Sq Ft
$547/Sq Ft
Est. Value
About This Home
This home is located at 1054 Santa Ynez Way, Sacramento, CA 95816 and is currently estimated at $636,711, approximately $547 per square foot. 1054 Santa Ynez Way is a home located in Sacramento County with nearby schools including David Lubin Elementary, Miwok Middle School, and Hiram W. Johnson High School.
Ownership History
Date
Name
Owned For
Owner Type
Purchase Details
Closed on
May 12, 2011
Sold by
Hamm Laurel C and Hamm Laurel
Bought by
Hamm Laurel C
Current Estimated Value
Home Financials for this Owner
Home Financials are based on the most recent Mortgage that was taken out on this home.
Original Mortgage
$224,000
Outstanding Balance
$86,593
Interest Rate
4.84%
Mortgage Type
New Conventional
Estimated Equity
$550,118
Purchase Details
Closed on
Jun 23, 2000
Sold by
Miles Shireen Susan
Bought by
Hamm Laurel
Home Financials for this Owner
Home Financials are based on the most recent Mortgage that was taken out on this home.
Original Mortgage
$142,400
Interest Rate
7.87%
Purchase Details
Closed on
Mar 3, 1994
Sold by
Miles Shireen Susan
Bought by
Miles Shireen Susan
Home Financials for this Owner
Home Financials are based on the most recent Mortgage that was taken out on this home.
Original Mortgage
$75,000
Interest Rate
7%
Create a Home Valuation Report for This Property
The Home Valuation Report is an in-depth analysis detailing your home's value as well as a comparison with similar homes in the area
Home Values in the Area
Average Home Value in this Area
Purchase History
| Date | Buyer | Sale Price | Title Company |
|---|---|---|---|
| Hamm Laurel C | -- | Fidelity National Title Co | |
| Hamm Laurel | $178,000 | North American Title Guarant | |
| Miles Shireen Susan | -- | Chicago Title Insurance Co |
Source: Public Records
Mortgage History
| Date | Status | Borrower | Loan Amount |
|---|---|---|---|
| Open | Hamm Laurel C | $224,000 | |
| Closed | Hamm Laurel | $142,400 | |
| Previous Owner | Miles Shireen Susan | $75,000 | |
| Closed | Hamm Laurel | $26,700 |
Source: Public Records
Tax History Compared to Growth
Tax History
| Year | Tax Paid | Tax Assessment Tax Assessment Total Assessment is a certain percentage of the fair market value that is determined by local assessors to be the total taxable value of land and additions on the property. | Land | Improvement |
|---|---|---|---|---|
| 2025 | $3,245 | $276,723 | $94,918 | $181,805 |
| 2024 | $3,245 | $271,298 | $93,057 | $178,241 |
| 2023 | $3,167 | $265,980 | $91,233 | $174,747 |
| 2022 | $3,112 | $260,766 | $89,445 | $171,321 |
| 2021 | $2,965 | $255,654 | $87,692 | $167,962 |
| 2020 | $2,988 | $253,033 | $86,793 | $166,240 |
| 2019 | $2,924 | $248,073 | $85,092 | $162,981 |
| 2018 | $2,847 | $243,210 | $83,424 | $159,786 |
| 2017 | $2,806 | $238,442 | $81,789 | $156,653 |
| 2016 | $2,734 | $233,768 | $80,186 | $153,582 |
| 2015 | $2,693 | $230,258 | $78,982 | $151,276 |
| 2014 | $2,620 | $225,748 | $77,435 | $148,313 |
Source: Public Records
Map
Nearby Homes
- 1064 Santa Ynez Way
- 1044 Santa Ynez Way
- 1080 Santa Ynez Way
- 1034 Santa Ynez Way
- 1045 35th St
- 1037 35th St
- 1053 35th St
- 1055 Santa Ynez Way
- 1065 Santa Ynez Way
- 1045 Santa Ynez Way
- 1024 Santa Ynez Way
- 1027 35th St
- 1101 35th St
- 1083 Santa Ynez Way
- 1035 Santa Ynez Way
- 1014 Santa Ynez Way
- 1115 35th St
- 1025 Santa Ynez Way
- 1054 36th St
- 1064 36th St