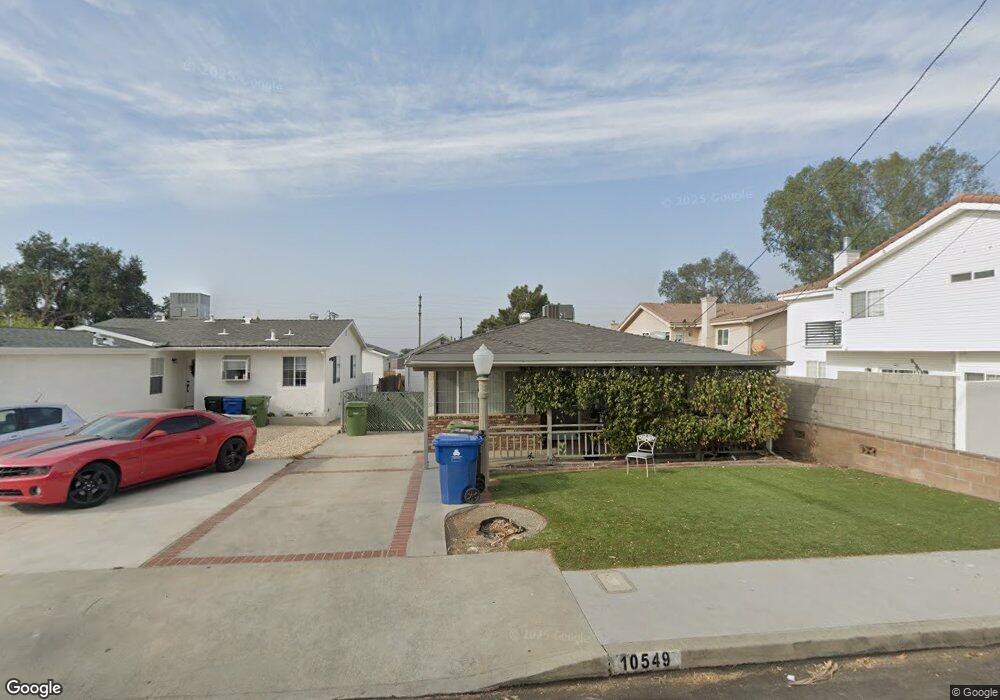
10549 Leolang Ave Sunland, CA 91040
Sunland NeighborhoodEstimated Value: $803,961 - $963,000
3
Beds
2
Baths
1,573
Sq Ft
$549/Sq Ft
Est. Value
About This Home
This home is located at 10549 Leolang Ave, Sunland, CA 91040 and is currently estimated at $863,490, approximately $548 per square foot. 10549 Leolang Ave is a home located in Los Angeles County with nearby schools including Mt. Gleason Middle School, Verdugo Hills Senior High School, and Plainview Academic Charter Academy.
Ownership History
Date
Name
Owned For
Owner Type
Purchase Details
Closed on
Jul 16, 2025
Sold by
Turner Douglas and Turner Charlotte
Bought by
Turner Living Trust and Turner
Current Estimated Value
Purchase Details
Closed on
Apr 28, 2015
Sold by
Turner Douglas and Turner Charlotte
Bought by
Turner Douglas and Turner Charlotte
Home Financials for this Owner
Home Financials are based on the most recent Mortgage that was taken out on this home.
Original Mortgage
$220,000
Interest Rate
3.73%
Mortgage Type
New Conventional
Create a Home Valuation Report for This Property
The Home Valuation Report is an in-depth analysis detailing your home's value as well as a comparison with similar homes in the area
Home Values in the Area
Average Home Value in this Area
Purchase History
| Date | Buyer | Sale Price | Title Company |
|---|---|---|---|
| Turner Living Trust | -- | None Listed On Document | |
| Turner Douglas | -- | Fidelity National Title |
Source: Public Records
Mortgage History
| Date | Status | Borrower | Loan Amount |
|---|---|---|---|
| Previous Owner | Turner Douglas | $220,000 |
Source: Public Records
Tax History Compared to Growth
Tax History
| Year | Tax Paid | Tax Assessment Tax Assessment Total Assessment is a certain percentage of the fair market value that is determined by local assessors to be the total taxable value of land and additions on the property. | Land | Improvement |
|---|---|---|---|---|
| 2025 | $4,450 | $352,844 | $204,906 | $147,938 |
| 2024 | $4,450 | $345,927 | $200,889 | $145,038 |
| 2023 | $4,368 | $339,145 | $196,950 | $142,195 |
| 2022 | $4,169 | $332,496 | $193,089 | $139,407 |
| 2021 | $4,113 | $325,977 | $189,303 | $136,674 |
| 2019 | $3,993 | $316,310 | $183,689 | $132,621 |
| 2018 | $3,881 | $310,109 | $180,088 | $130,021 |
| 2016 | $3,697 | $298,069 | $173,096 | $124,973 |
| 2015 | $3,644 | $293,592 | $170,496 | $123,096 |
| 2014 | $3,664 | $287,842 | $167,157 | $120,685 |
Source: Public Records
Map
Nearby Homes
- 7860 Fenwick St
- 7851 Fenwick St
- 10623 Woodward Ave
- 10529 Mount Gleason Ave
- 10414 Whitegate Ave
- 10404 Jardine Ave
- 10530 Mcvine Ave
- 10300 Whitegate Ave
- 10430 Mcvine Ave
- 10415 Mcvine Ave Unit 2
- 7848 Forsythe St
- 7961 Day St
- 8230 Hillrose St
- 7755 Forsythe St
- 10338 Scoville Ave
- 7861 Cora St
- 10831 Odell Ave
- 10621 Helendale Ave
- 8352 Wyngate St
- 10549 Mcclemont Ave
- 10545 Leolang Ave
- 10547 Leolang Ave
- 10545 1/2 Leolang Ave
- 7930 Fenwick St
- 7940 Fenwick St
- 10537 Leolang Ave
- 7950 Fenwick St
- 10548 Woodward Ave
- 10556 Leolang Ave
- 10542 Woodward Ave
- 10550 Leolang Ave
- 10533 Leolang Ave
- 10540 Woodward Ave
- 10542 Leolang Ave
- 10554 Leolang Ave
- 7960 Fenwick St
- 10536 Woodward Ave
- 10605 Leolang Ave
- 10529 Leolang Ave
- 10532 Woodward Ave