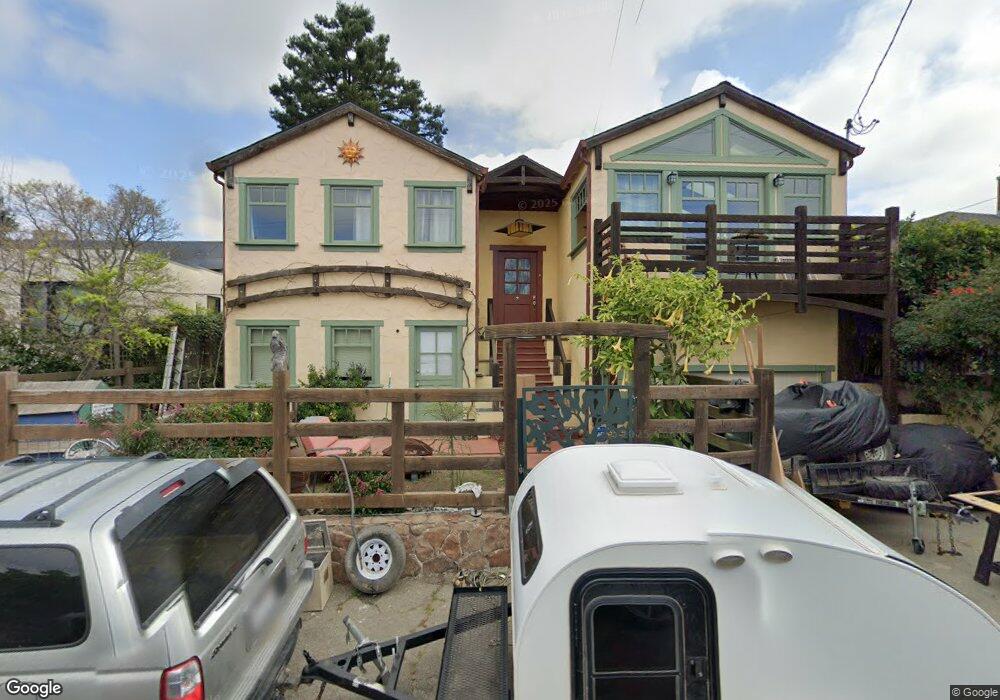
1055 Creston Rd Berkeley, CA 94708
Berkeley Hills NeighborhoodEstimated Value: $1,452,000 - $2,084,000
3
Beds
2
Baths
1,552
Sq Ft
$1,091/Sq Ft
Est. Value
About This Home
This home is located at 1055 Creston Rd, Berkeley, CA 94708 and is currently estimated at $1,693,605, approximately $1,091 per square foot. 1055 Creston Rd is a home located in Alameda County with nearby schools including Cragmont Elementary School, Berkeley Arts Magnet at Whittier School, and Washington Elementary School.
Ownership History
Date
Name
Owned For
Owner Type
Purchase Details
Closed on
Oct 5, 2021
Sold by
Volimar John E and Alessi Pauline
Bought by
Vollmar John E
Current Estimated Value
Home Financials for this Owner
Home Financials are based on the most recent Mortgage that was taken out on this home.
Original Mortgage
$574,825
Interest Rate
2.9%
Mortgage Type
New Conventional
Purchase Details
Closed on
Aug 26, 2002
Sold by
Judd Martha L and The Martha L Judd Trust
Bought by
Vollmar John E and Alessi Pauline
Home Financials for this Owner
Home Financials are based on the most recent Mortgage that was taken out on this home.
Original Mortgage
$400,000
Interest Rate
6.43%
Purchase Details
Closed on
Jan 6, 1999
Sold by
Judd Martha L
Bought by
Judd Martha L and Martha L Judd Trust
Create a Home Valuation Report for This Property
The Home Valuation Report is an in-depth analysis detailing your home's value as well as a comparison with similar homes in the area
Home Values in the Area
Average Home Value in this Area
Purchase History
| Date | Buyer | Sale Price | Title Company |
|---|---|---|---|
| Vollmar John E | -- | Amrock Inc | |
| Vollmar John E | $575,000 | Placer Title Company | |
| Judd Martha L | -- | -- |
Source: Public Records
Mortgage History
| Date | Status | Borrower | Loan Amount |
|---|---|---|---|
| Previous Owner | Vollmar John E | $574,825 | |
| Previous Owner | Vollmar John E | $400,000 |
Source: Public Records
Tax History
| Year | Tax Paid | Tax Assessment Tax Assessment Total Assessment is a certain percentage of the fair market value that is determined by local assessors to be the total taxable value of land and additions on the property. | Land | Improvement |
|---|---|---|---|---|
| 2025 | $13,581 | $825,714 | $249,814 | $582,900 |
| 2024 | $13,581 | $809,390 | $244,917 | $571,473 |
| 2023 | $13,286 | $800,387 | $240,116 | $560,271 |
| 2022 | $13,023 | $777,696 | $235,409 | $549,287 |
| 2021 | $13,038 | $762,314 | $230,794 | $538,520 |
| 2020 | $12,281 | $761,431 | $228,429 | $533,002 |
| 2019 | $11,735 | $746,504 | $223,951 | $522,553 |
| 2018 | $11,523 | $731,871 | $219,561 | $512,310 |
| 2017 | $11,118 | $717,524 | $215,257 | $502,267 |
| 2016 | $10,722 | $703,460 | $211,038 | $492,422 |
| 2015 | $10,571 | $692,897 | $207,869 | $485,028 |
| 2014 | $10,431 | $679,327 | $203,798 | $475,529 |
Source: Public Records
Map
Nearby Homes
- 1085 Creston Rd
- 1024 Grizzly Peak Blvd
- 935 Grizzly Peak Blvd
- 1110 Sterling Ave
- 1160 Miller Ave
- 1155 Keeler Ave
- 730 Wildcat Canyon Rd
- 962 Regal Rd
- 1165 Cragmont Ave
- 1106 Cragmont Ave
- 1221 Grizzly Peak Blvd
- 1004 Cragmont Ave
- 777 Cragmont Ave
- 2686 Shasta Rd
- 938 San Benito Rd
- 1375 Queens Rd
- 606 Grizzly Peak Blvd
- 758 Spruce St
- 2315 Eunice St
- 614 Cragmont Ave
- 1051 Creston Rd
- 1061 Creston Rd
- 1065 Creston Rd
- 1010 Overlook Rd
- 1050 Creston Rd
- 130 Latham Ln
- 1056 Creston Rd
- 1047 Creston Rd
- 1069 Creston Rd
- 1016 Overlook Rd
- 1064 Creston Rd
- 1048 Creston Rd
- 125 Latham Ln
- 1045 Creston Rd
- 1075 Creston Rd
- 1020 Overlook Rd
- 1044 Creston Rd
- 1066 Creston Rd
- 1039 Creston Rd
- 1024 Overlook Rd
Your Personal Tour Guide
Ask me questions while you tour the home.