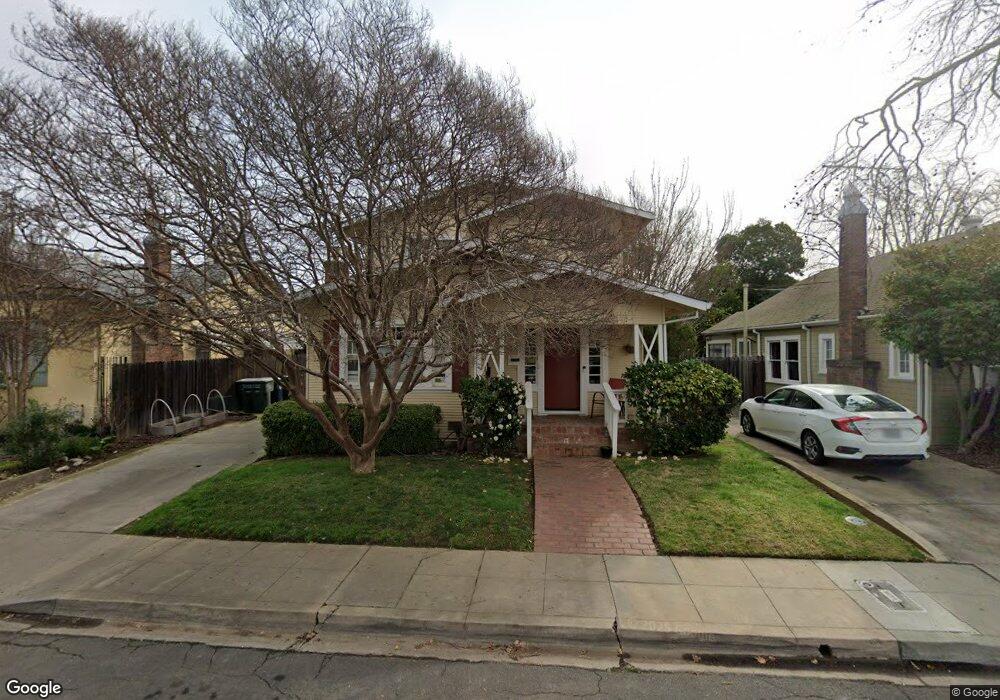
1055 Santa Ynez Way Sacramento, CA 95816
East Sacramento NeighborhoodEstimated Value: $521,000 - $832,000
3
Beds
2
Baths
1,472
Sq Ft
$479/Sq Ft
Est. Value
About This Home
This home is located at 1055 Santa Ynez Way, Sacramento, CA 95816 and is currently estimated at $705,334, approximately $479 per square foot. 1055 Santa Ynez Way is a home located in Sacramento County with nearby schools including David Lubin Elementary, Miwok Middle School, and Hiram W. Johnson High School.
Ownership History
Date
Name
Owned For
Owner Type
Purchase Details
Closed on
Feb 1, 2012
Sold by
Dennis Lorraine
Bought by
Dennis Lorraine and Thomas Stephen D
Current Estimated Value
Home Financials for this Owner
Home Financials are based on the most recent Mortgage that was taken out on this home.
Original Mortgage
$300,000
Outstanding Balance
$205,629
Interest Rate
3.9%
Mortgage Type
New Conventional
Estimated Equity
$499,705
Purchase Details
Closed on
May 19, 2008
Sold by
Schade John J and The John J Schade Revocable Tr
Bought by
Dennis Lorraine
Home Financials for this Owner
Home Financials are based on the most recent Mortgage that was taken out on this home.
Original Mortgage
$315,000
Interest Rate
5.5%
Mortgage Type
Reverse Mortgage Home Equity Conversion Mortgage
Purchase Details
Closed on
Apr 25, 2005
Sold by
Schade John J
Bought by
Schade John J and John J Schade Revocable Trust
Create a Home Valuation Report for This Property
The Home Valuation Report is an in-depth analysis detailing your home's value as well as a comparison with similar homes in the area
Home Values in the Area
Average Home Value in this Area
Purchase History
| Date | Buyer | Sale Price | Title Company |
|---|---|---|---|
| Dennis Lorraine | -- | Old Republic Title Company | |
| Dennis Lorraine | $465,000 | Stewart Title Of Sacramento | |
| Schade John J | -- | -- |
Source: Public Records
Mortgage History
| Date | Status | Borrower | Loan Amount |
|---|---|---|---|
| Open | Dennis Lorraine | $300,000 | |
| Closed | Dennis Lorraine | $315,000 |
Source: Public Records
Tax History Compared to Growth
Tax History
| Year | Tax Paid | Tax Assessment Tax Assessment Total Assessment is a certain percentage of the fair market value that is determined by local assessors to be the total taxable value of land and additions on the property. | Land | Improvement |
|---|---|---|---|---|
| 2025 | $7,089 | $610,771 | $248,248 | $362,523 |
| 2024 | $7,089 | $598,796 | $243,381 | $355,415 |
| 2023 | $6,922 | $587,056 | $238,609 | $348,447 |
| 2022 | $6,807 | $575,546 | $233,931 | $341,615 |
| 2021 | $6,482 | $564,262 | $229,345 | $334,917 |
| 2020 | $6,541 | $558,477 | $226,994 | $331,483 |
| 2019 | $6,401 | $547,528 | $222,544 | $324,984 |
| 2018 | $6,235 | $536,793 | $218,181 | $318,612 |
| 2017 | $6,150 | $526,268 | $213,903 | $312,365 |
| 2016 | $6,035 | $515,950 | $209,709 | $306,241 |
| 2015 | $5,775 | $492,991 | $224,087 | $268,904 |
| 2014 | $5,563 | $478,632 | $217,560 | $261,072 |
Source: Public Records
Map
Nearby Homes
- 1065 Santa Ynez Way
- 1045 Santa Ynez Way
- 1083 Santa Ynez Way
- 1054 36th St
- 1035 Santa Ynez Way
- 1064 36th St
- 1044 36th St
- 1074 36th St
- 1054 Santa Ynez Way
- 1044 Santa Ynez Way
- 1034 36th St
- 1064 Santa Ynez Way
- 1025 Santa Ynez Way
- 1034 Santa Ynez Way
- 1080 Santa Ynez Way
- 1024 36th St
- 1024 Santa Ynez Way
- 1015 Santa Ynez Way
- 1014 Santa Ynez Way
- 1045 35th St