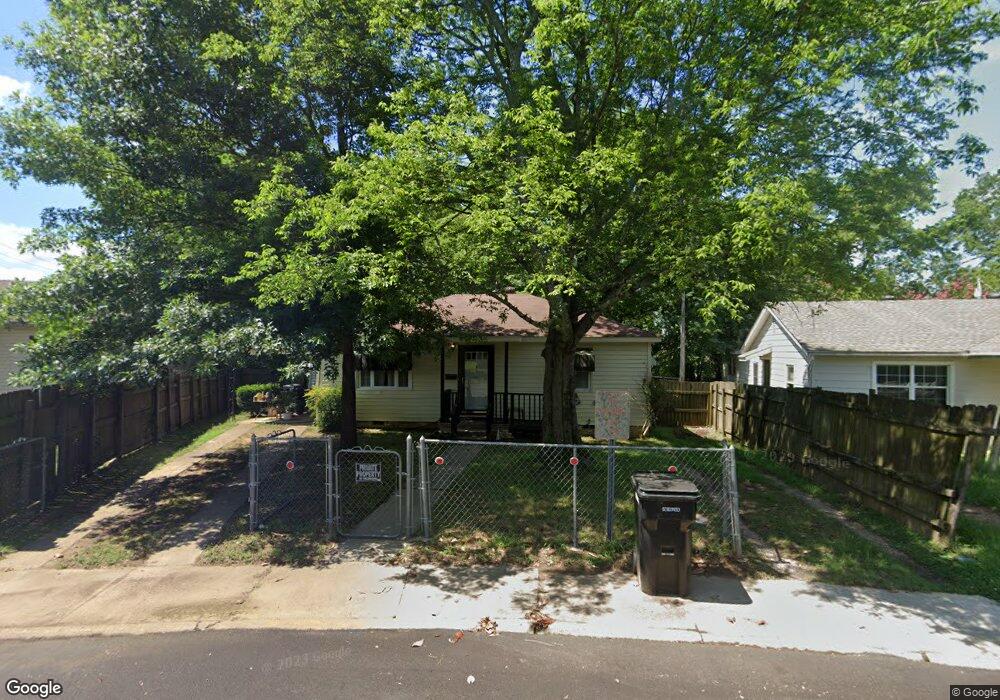
106 Border Cir Benton, AR 72015
Estimated Value: $106,000 - $128,000
Studio
1
Bath
936
Sq Ft
$126/Sq Ft
Est. Value
About This Home
This home is located at 106 Border Cir, Benton, AR 72015 and is currently estimated at $117,923, approximately $125 per square foot. 106 Border Cir is a home located in Saline County with nearby schools including Angie Grant Elementary School, Benton Middle School, and Benton Junior High School.
Ownership History
Date
Name
Owned For
Owner Type
Purchase Details
Closed on
Sep 4, 2024
Sold by
Watson John
Bought by
Pl Mclean Realty Llc
Current Estimated Value
Home Financials for this Owner
Home Financials are based on the most recent Mortgage that was taken out on this home.
Original Mortgage
$87,200
Outstanding Balance
$86,276
Interest Rate
6.78%
Mortgage Type
New Conventional
Estimated Equity
$31,647
Purchase Details
Closed on
Dec 18, 2009
Sold by
Ashley Jim G
Bought by
Watson John
Home Financials for this Owner
Home Financials are based on the most recent Mortgage that was taken out on this home.
Original Mortgage
$66,276
Interest Rate
4.9%
Mortgage Type
FHA
Purchase Details
Closed on
Jan 29, 2004
Bought by
Ashley
Create a Home Valuation Report for This Property
The Home Valuation Report is an in-depth analysis detailing your home's value as well as a comparison with similar homes in the area
Home Values in the Area
Average Home Value in this Area
Purchase History
| Date | Buyer | Sale Price | Title Company |
|---|---|---|---|
| Pl Mclean Realty Llc | $113,000 | American Abstract & Title | |
| Pl Mclean Realty Llc | $113,000 | American Abstract & Title | |
| Watson John | $68,000 | -- | |
| Ashley | -- | -- | |
| Ashley | $55,000 | -- |
Source: Public Records
Mortgage History
| Date | Status | Borrower | Loan Amount |
|---|---|---|---|
| Open | Pl Mclean Realty Llc | $87,200 | |
| Closed | Pl Mclean Realty Llc | $87,200 | |
| Previous Owner | Watson John | $66,276 |
Source: Public Records
Tax History
| Year | Tax Paid | Tax Assessment Tax Assessment Total Assessment is a certain percentage of the fair market value that is determined by local assessors to be the total taxable value of land and additions on the property. | Land | Improvement |
|---|---|---|---|---|
| 2025 | $741 | $13,371 | $2,760 | $10,611 |
| 2024 | $758 | $13,371 | $2,760 | $10,611 |
| 2023 | $741 | $13,371 | $2,760 | $10,611 |
| 2022 | $683 | $13,371 | $2,760 | $10,611 |
| 2021 | $621 | $11,210 | $2,300 | $8,910 |
| 2020 | $621 | $11,210 | $2,300 | $8,910 |
| 2019 | $621 | $11,210 | $2,300 | $8,910 |
| 2018 | $620 | $11,210 | $2,300 | $8,910 |
| 2017 | $270 | $11,210 | $2,300 | $8,910 |
| 2016 | $822 | $14,500 | $2,300 | $12,200 |
| 2015 | $458 | $14,500 | $2,300 | $12,200 |
| 2014 | $463 | $14,500 | $2,300 | $12,200 |
Source: Public Records
Map
Nearby Homes
Your Personal Tour Guide
Ask me questions while you tour the home.