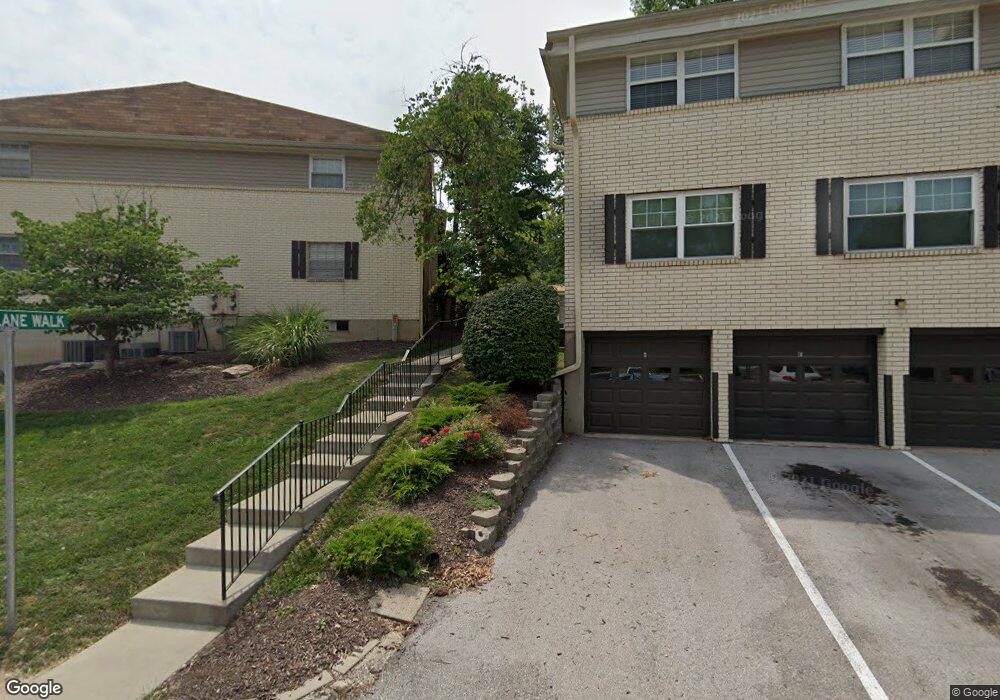
106 Shadalane Walk Unit C Ballwin, MO 63011
Estimated Value: $137,000 - $149,205
2
Beds
2
Baths
888
Sq Ft
$160/Sq Ft
Est. Value
About This Home
This home is located at 106 Shadalane Walk Unit C, Ballwin, MO 63011 and is currently estimated at $142,301, approximately $160 per square foot. 106 Shadalane Walk Unit C is a home located in St. Louis County with nearby schools including Westridge Elementary School, Crestview Middle School, and Marquette Sr. High School.
Ownership History
Date
Name
Owned For
Owner Type
Purchase Details
Closed on
May 18, 2001
Sold by
Neuse Douglas J and Neuse Stephanie
Bought by
Jusufovic Edin
Current Estimated Value
Home Financials for this Owner
Home Financials are based on the most recent Mortgage that was taken out on this home.
Original Mortgage
$44,900
Interest Rate
7.1%
Purchase Details
Closed on
Oct 2, 2000
Sold by
Bahmler Janice L
Bought by
Neuse Douglas J and Sigman John H
Purchase Details
Closed on
Aug 16, 2000
Sold by
Bahmler Richard P and Nemmers Cynthia J
Bought by
Bahmler Janice L
Purchase Details
Closed on
Jul 1, 1998
Sold by
Hall Arlene D
Bought by
Bahmler Janice L and Bahmler Richard P
Purchase Details
Closed on
Nov 25, 1997
Sold by
Phillips Harvey I and Phillips Barbara J
Bought by
Hall Arlene D
Home Financials for this Owner
Home Financials are based on the most recent Mortgage that was taken out on this home.
Original Mortgage
$28,000
Interest Rate
7.3%
Create a Home Valuation Report for This Property
The Home Valuation Report is an in-depth analysis detailing your home's value as well as a comparison with similar homes in the area
Home Values in the Area
Average Home Value in this Area
Purchase History
We collect this data history from publicly available records. To have your information removed, we recommend requesting removal directly through your county’s website.
| Date | Buyer | Sale Price | Title Company |
|---|---|---|---|
| Jusufovic Edin | $59,900 | -- | |
| Jusufovic Edin | $59,900 | -- | |
| Neuse Douglas J | $52,000 | -- | |
| Bahmler Janice L | -- | -- | |
| Bahmler Janice L | -- | -- | |
| Hall Arlene D | -- | -- |
Source: Public Records
Mortgage History
We collect this data history from publicly available records. To have your information removed, we recommend requesting removal directly through your county’s website.
| Date | Status | Borrower | Loan Amount |
|---|---|---|---|
| Closed | Jusufovic Edin | $44,900 | |
| Previous Owner | Hall Arlene D | $28,000 |
Source: Public Records
Tax History
| Year | Tax Paid | Tax Assessment Tax Assessment Total Assessment is a certain percentage of the fair market value that is determined by local assessors to be the total taxable value of land and additions on the property. | Land | Improvement |
|---|---|---|---|---|
| 2025 | $1,489 | $25,630 | $8,090 | $17,540 |
| 2024 | $1,489 | $21,410 | $3,040 | $18,370 |
| 2023 | $1,488 | $21,410 | $3,040 | $18,370 |
| 2022 | $1,193 | $15,950 | $4,640 | $11,310 |
| 2021 | $1,184 | $15,950 | $4,640 | $11,310 |
| 2020 | $1,192 | $15,310 | $3,380 | $11,930 |
| 2019 | $1,197 | $15,310 | $3,380 | $11,930 |
| 2018 | $1,003 | $11,760 | $2,700 | $9,060 |
| 2017 | $980 | $11,760 | $2,700 | $9,060 |
| 2016 | $1,049 | $12,130 | $2,360 | $9,770 |
| 2015 | $1,028 | $12,130 | $2,360 | $9,770 |
| 2014 | $1,179 | $13,610 | $3,330 | $10,280 |
Source: Public Records
Map
Nearby Homes
- 845 Wendevy Ct Unit 12B
- 842 Wendevy Ct
- 138 Shadalane Walk Unit G
- 140 Burtonwood Dr
- 131 Romine Cir
- 915 Coronet Dr
- 809 Lindell Dr
- 609 Log Hill Ct
- 309 Providence Rd
- 1080 Sagebrush Trail
- 160 Lucerne Place Dr
- 246 Westridge Parc Ln
- 329 Meadowbrook Dr
- 847 Palm Bay Dr
- 259 White Tree Ln
- 349 Nantucket Dr
- 15583 Clayton Rd
- 1206 Fairview Dr
- 112 Shirley Ln
- 249 Reinke Rd
- 102 Shadalane Walk Unit B
- 102 Shadalane Walk Unit H
- 102 Shadalane Walk Unit G
- 102 Shadalane Walk Unit F
- 102 Shadalane Walk Unit E
- 102 Shadalane Walk Unit D
- 102 Shadalane Walk Unit C
- 106 Shadalane Walk Unit F
- 106 Shadalane Walk Unit G
- 106 Shadalane Walk Unit H
- 106 Shadalane Walk Unit D
- 106 Shadalane Walk Unit B
- 106 Shadalane Walk Unit E
- 106 Shadalane Walk Unit A
- 121 Shadalane Walk Unit 27A
- 123 Shadalane Walk
- 127 Shadalane Walk
- 131 Shadalane Walk Unit A
- 133 Shadalane Walk Unit 26B
- 135 Shadalane Walk Unit 26C
Your Personal Tour Guide
Ask me questions while you tour the home.