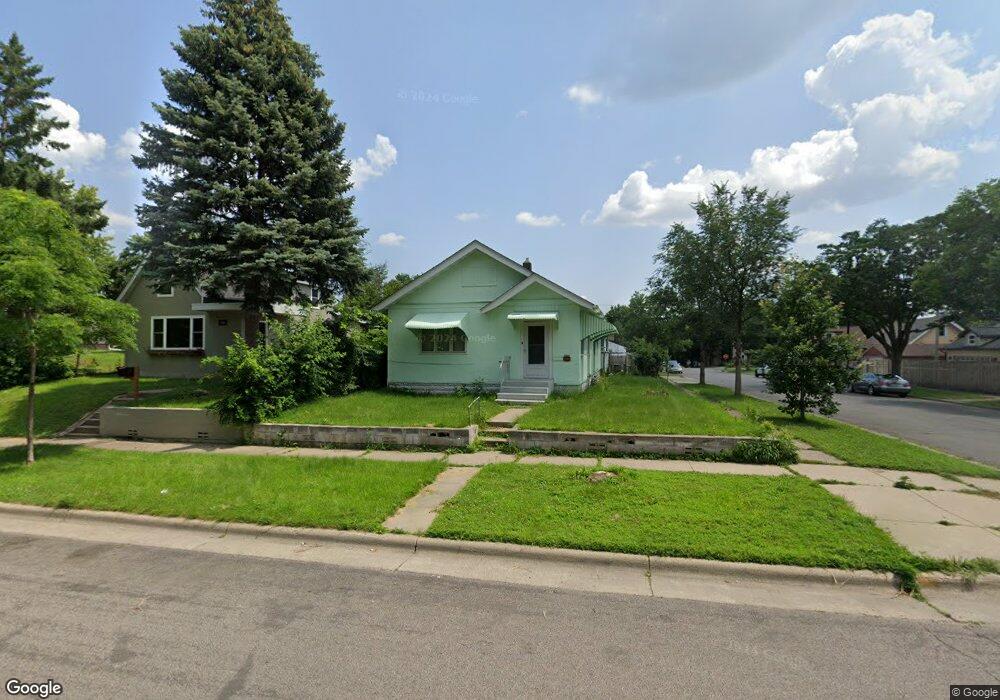
1060 Farrington St Saint Paul, MN 55117
North End NeighborhoodEstimated Value: $217,000 - $240,000
3
Beds
2
Baths
2,024
Sq Ft
$114/Sq Ft
Est. Value
About This Home
This home is located at 1060 Farrington St, Saint Paul, MN 55117 and is currently estimated at $229,822, approximately $113 per square foot. 1060 Farrington St is a home located in Ramsey County with nearby schools including Como Park Elementary School, Murray Middle School, and Como Park Senior High School.
Ownership History
Date
Name
Owned For
Owner Type
Purchase Details
Closed on
Aug 18, 2020
Sold by
Lee Shoua and Xiang Malina
Bought by
Bui Huyen T
Current Estimated Value
Home Financials for this Owner
Home Financials are based on the most recent Mortgage that was taken out on this home.
Original Mortgage
$128,400
Outstanding Balance
$113,687
Interest Rate
2.9%
Mortgage Type
New Conventional
Estimated Equity
$116,135
Purchase Details
Closed on
Jul 7, 2020
Sold by
Xiong Malina and Lee Shoua
Bought by
Xiong Malina and Lee Shoua
Home Financials for this Owner
Home Financials are based on the most recent Mortgage that was taken out on this home.
Original Mortgage
$128,400
Outstanding Balance
$113,687
Interest Rate
2.9%
Mortgage Type
New Conventional
Estimated Equity
$116,135
Purchase Details
Closed on
Feb 21, 2018
Sold by
Xiong Malina
Bought by
Xiong Malina and Lee Shoua
Purchase Details
Closed on
May 24, 2011
Sold by
Federal National Mortgage Association
Bought by
Xiong Malina
Purchase Details
Closed on
Nov 29, 2007
Sold by
Huber Linda M
Bought by
Yah Kyaw Zay and Kon Naw Du
Create a Home Valuation Report for This Property
The Home Valuation Report is an in-depth analysis detailing your home's value as well as a comparison with similar homes in the area
Home Values in the Area
Average Home Value in this Area
Purchase History
| Date | Buyer | Sale Price | Title Company |
|---|---|---|---|
| Bui Huyen T | $160,500 | Executive Title Services | |
| Xiong Malina | -- | None Available | |
| Xiong Malina | -- | None Available | |
| Xiong Malina | $58,000 | -- | |
| Yah Kyaw Zay | $139,000 | -- |
Source: Public Records
Mortgage History
| Date | Status | Borrower | Loan Amount |
|---|---|---|---|
| Open | Bui Huyen T | $128,400 |
Source: Public Records
Tax History Compared to Growth
Tax History
| Year | Tax Paid | Tax Assessment Tax Assessment Total Assessment is a certain percentage of the fair market value that is determined by local assessors to be the total taxable value of land and additions on the property. | Land | Improvement |
|---|---|---|---|---|
| 2025 | $2,894 | $220,900 | $25,000 | $195,900 |
| 2023 | $2,894 | $191,100 | $20,000 | $171,100 |
| 2022 | $2,300 | $185,700 | $20,000 | $165,700 |
| 2021 | $2,500 | $158,700 | $20,000 | $138,700 |
| 2020 | $2,816 | $175,700 | $11,900 | $163,800 |
| 2019 | $2,554 | $152,500 | $11,900 | $140,600 |
| 2018 | $1,524 | $147,000 | $11,900 | $135,100 |
| 2017 | $1,544 | $113,100 | $11,900 | $101,200 |
| 2016 | $1,386 | $0 | $0 | $0 |
| 2015 | $824 | $89,800 | $11,900 | $77,900 |
| 2014 | $1,162 | $0 | $0 | $0 |
Source: Public Records
Map
Nearby Homes
- 1071 Matilda St
- 1110 Virginia St
- 1011 Marion St
- 283 Front Ave
- 1083 Western Ave N
- 1040 Cumberland St
- 1131 Marion St
- 954 Galtier St
- 956 Western Ave N
- 1066 Woodbridge St
- 359 Stinson St W
- 250 Rose Ave W
- 916 Farrington St
- 950 Marion St
- 1156 Marion St
- 964 Woodbridge St
- 310 Burgess St
- 306 Burgess St
- 1215 Galtier St
- 940 Albemarle St
- 1066 Farrington St
- 1056 Farrington St
- 1056 1056 Farrington-Street-
- 1076 Farrington St
- 1076 1076 Farrington-Street-
- 297 Cook Ave W
- 1052 Farrington St
- 1052 1052 Farrington-Street-
- 1065 Matilda St
- 1055 Matilda St
- 1046 Farrington St
- 1086 Farrington St
- 1075 Matilda St
- 1063 Farrington St
- 1053 Matilda St
- 1053 1053 Matilda-Street-
- 1067 1067 Farrington-Street-
- 1055 Farrington St
- 1075 Farrington St
- 1042 Farrington St