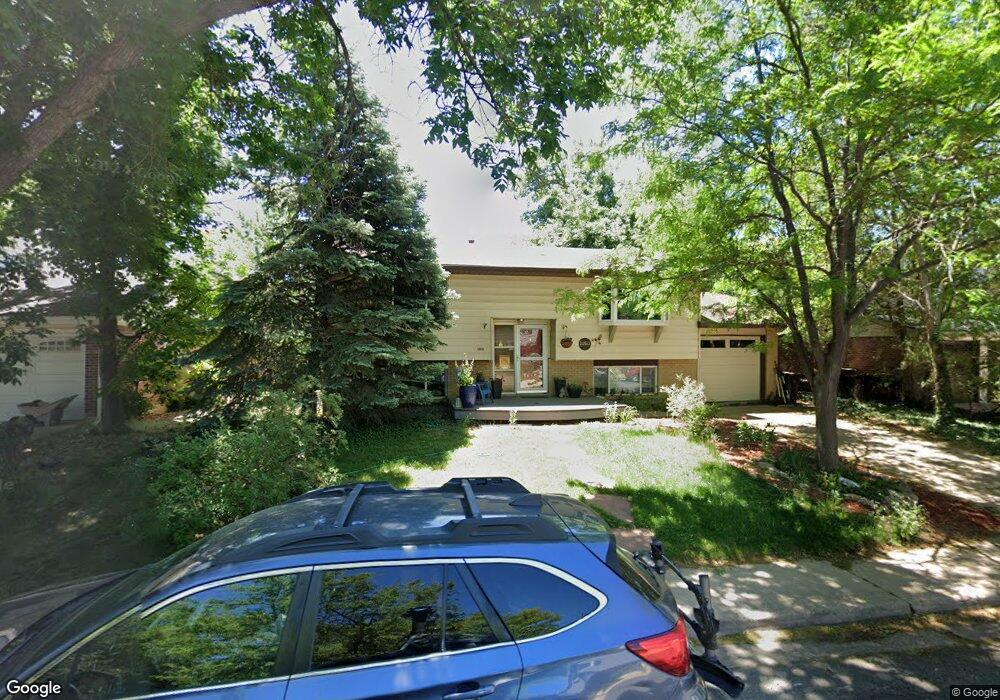
1060 Waite Dr Boulder, CO 80303
Southeast Boulder NeighborhoodEstimated Value: $763,370 - $942,000
4
Beds
2
Baths
946
Sq Ft
$893/Sq Ft
Est. Value
About This Home
This home is located at 1060 Waite Dr, Boulder, CO 80303 and is currently estimated at $844,593, approximately $892 per square foot. 1060 Waite Dr is a home located in Boulder County with nearby schools including Eisenhower Elementary School, Manhattan Middle School of the Arts & Academics, and Fairview High School.
Ownership History
Date
Name
Owned For
Owner Type
Purchase Details
Closed on
May 8, 2013
Sold by
Margolis Thomas J
Bought by
Dubow Wendy M
Current Estimated Value
Purchase Details
Closed on
Apr 8, 2003
Sold by
Dubow Wendy M
Bought by
Dubow Wendy M
Home Financials for this Owner
Home Financials are based on the most recent Mortgage that was taken out on this home.
Original Mortgage
$129,650
Interest Rate
5.64%
Purchase Details
Closed on
Apr 7, 1999
Sold by
Dunn Norma E
Bought by
Dubow Wendy M
Home Financials for this Owner
Home Financials are based on the most recent Mortgage that was taken out on this home.
Original Mortgage
$130,000
Interest Rate
6.89%
Purchase Details
Closed on
May 14, 1991
Bought by
Dubow Wendy M
Purchase Details
Closed on
Jun 26, 1972
Bought by
Dubow Wendy M
Create a Home Valuation Report for This Property
The Home Valuation Report is an in-depth analysis detailing your home's value as well as a comparison with similar homes in the area
Home Values in the Area
Average Home Value in this Area
Purchase History
| Date | Buyer | Sale Price | Title Company |
|---|---|---|---|
| Dubow Wendy M | -- | None Available | |
| Dubow Wendy M | -- | -- | |
| Dubow Wendy M | $229,650 | -- | |
| Dubow Wendy M | -- | -- | |
| Dubow Wendy M | -- | -- |
Source: Public Records
Mortgage History
| Date | Status | Borrower | Loan Amount |
|---|---|---|---|
| Previous Owner | Dubow Wendy M | $129,650 | |
| Previous Owner | Dubow Wendy M | $130,000 |
Source: Public Records
Tax History
| Year | Tax Paid | Tax Assessment Tax Assessment Total Assessment is a certain percentage of the fair market value that is determined by local assessors to be the total taxable value of land and additions on the property. | Land | Improvement |
|---|---|---|---|---|
| 2025 | $4,824 | $50,113 | $31,025 | $19,088 |
| 2024 | $4,824 | $50,113 | $31,025 | $19,088 |
| 2023 | $4,740 | $54,886 | $36,388 | $22,184 |
| 2022 | $4,105 | $44,209 | $26,125 | $18,084 |
| 2021 | $3,915 | $45,481 | $26,877 | $18,604 |
| 2020 | $3,651 | $41,942 | $23,524 | $18,418 |
| 2019 | $3,595 | $41,942 | $23,524 | $18,418 |
| 2018 | $3,508 | $40,457 | $22,104 | $18,353 |
| 2017 | $3,398 | $44,727 | $24,437 | $20,290 |
| 2016 | $3,209 | $37,070 | $16,318 | $20,752 |
| 2015 | $3,039 | $31,155 | $17,512 | $13,643 |
| 2014 | $2,620 | $31,155 | $17,512 | $13,643 |
Source: Public Records
Map
Nearby Homes
- 5016 Forsythe Place
- 5044 Gallatin Place
- 4222 Monroe Dr Unit C
- 1180 Monroe Dr Unit B
- 4500 Baseline Rd Unit 1208
- 4415 Laguna Place Unit 201
- 695 Manhattan Dr Unit 116
- 695 Manhattan Dr Unit 109
- 695 Manhattan Dr Unit 219
- 5411 White Place
- 4475 Laguna Place Unit 206
- 665 Manhattan Dr Unit 9
- 5586 Pennsylvania Ave
- 625 Manhattan Place Unit 308
- 600 Manhattan Dr
- 655 Cree Cir
- 501 Manhattan Dr Unit 101
- 905 36th St
- 780 33rd St
- 3161 Madison Ave Unit 313
- 1050 Waite Dr
- 1070 Waite Dr
- 4745 Shoup Place
- 4755 Shoup Place
- 1040 Waite Dr
- 4735 Shoup Place
- 1080 Waite Dr
- 4765 Shoup Place
- 1065 Waite Dr
- 1075 Waite Dr
- 4725 Shoup Place
- 1055 Waite Dr
- 1030 Waite Dr
- 1095 Waite Dr
- 4775 Shoup Place
- 1090 Waite Dr
- 1045 Waite Dr
- 4715 Shoup Place
- 1020 Waite Dr
- 4785 Shoup Place
Your Personal Tour Guide
Ask me questions while you tour the home.