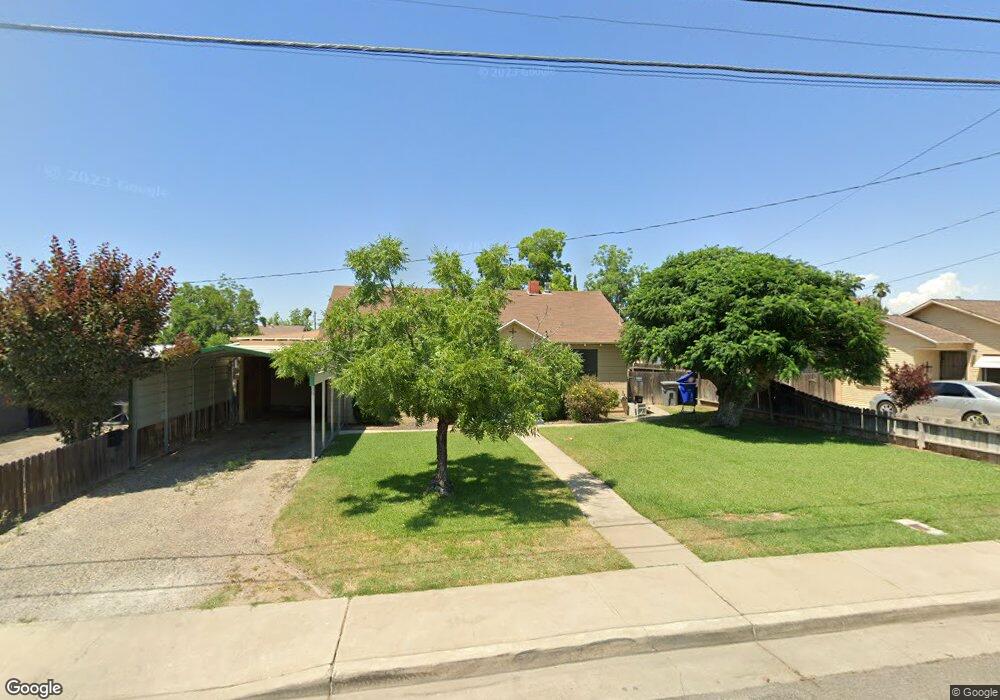
1062 E Duff Ave Reedley, CA 93654
Estimated Value: $208,991 - $240,000
3
Beds
1
Bath
919
Sq Ft
$249/Sq Ft
Est. Value
About This Home
This home is located at 1062 E Duff Ave, Reedley, CA 93654 and is currently estimated at $228,997, approximately $249 per square foot. 1062 E Duff Ave is a home located in Fresno County with nearby schools including Jefferson Elementary School, General Grant Middle School, and Reedley High School.
Ownership History
Date
Name
Owned For
Owner Type
Purchase Details
Closed on
Mar 13, 1998
Sold by
Robledo Richard and Robledo Gloria
Bought by
Robledo Richard and Robledo Gloria
Current Estimated Value
Home Financials for this Owner
Home Financials are based on the most recent Mortgage that was taken out on this home.
Original Mortgage
$48,000
Interest Rate
6.61%
Mortgage Type
Unknown
Purchase Details
Closed on
May 13, 1997
Sold by
Wanda Jorgensen and Wanda Alvin J
Bought by
Robledo Richard and Robledo Gloria
Home Financials for this Owner
Home Financials are based on the most recent Mortgage that was taken out on this home.
Original Mortgage
$25,000
Interest Rate
8.08%
Mortgage Type
Seller Take Back
Purchase Details
Closed on
Jun 7, 1996
Sold by
Robledo Richard and Robledo Gloria
Bought by
Robledo Richard and Robledo Gloria
Create a Home Valuation Report for This Property
The Home Valuation Report is an in-depth analysis detailing your home's value as well as a comparison with similar homes in the area
Home Values in the Area
Average Home Value in this Area
Purchase History
| Date | Buyer | Sale Price | Title Company |
|---|---|---|---|
| Robledo Richard | -- | Chicago Title Co | |
| Robledo Richard | $40,000 | Chicago Title Co | |
| Robledo Richard | -- | Chicago Title Co |
Source: Public Records
Mortgage History
| Date | Status | Borrower | Loan Amount |
|---|---|---|---|
| Closed | Robledo Richard | $48,000 | |
| Open | Robledo Richard | $73,600 | |
| Closed | Robledo Richard | $25,000 |
Source: Public Records
Tax History
| Year | Tax Paid | Tax Assessment Tax Assessment Total Assessment is a certain percentage of the fair market value that is determined by local assessors to be the total taxable value of land and additions on the property. | Land | Improvement |
|---|---|---|---|---|
| 2025 | $878 | $75,623 | $29,848 | $45,775 |
| 2023 | $860 | $72,689 | $28,690 | $43,999 |
| 2022 | $869 | $71,265 | $28,128 | $43,137 |
| 2021 | $843 | $69,869 | $27,577 | $42,292 |
| 2020 | $858 | $69,154 | $27,295 | $41,859 |
| 2019 | $827 | $67,799 | $26,760 | $41,039 |
| 2018 | $833 | $66,471 | $26,236 | $40,235 |
| 2017 | $787 | $65,169 | $25,722 | $39,447 |
| 2016 | $807 | $63,892 | $25,218 | $38,674 |
| 2015 | $773 | $62,934 | $24,840 | $38,094 |
| 2014 | $779 | $61,702 | $24,354 | $37,348 |
Source: Public Records
Map
Nearby Homes
- 1064 E Early Ave
- 1185 E Evening Glow Ave
- 864 E Evening Glow Ave
- 259 E Evening Glow Cir
- 155 N Haney Ave
- 216 S Sunset Ave
- 223 S Kady Ave
- 1372 E Laroda Cir
- 1055 E Dinuba Ave
- 1590 E Dinuba Ave
- 1249 D St
- 1205 F St
- 574 N Frankwood Ave
- 2347 E Jefferson Ave
- 266 E Linden Ave
- 165 E Linden Ave
- 440 E Stanley Ave
- 1405 E Cypress Ave Unit 157
- 1405 E Cypress Ave Unit 137
- 1375 S Cyrier Ave
- 1042 E Duff Ave
- 1078 E Duff Ave
- 1028 E Duff Ave
- 1104 E Duff Ave
- 1061 E Early Ave
- 1051 E Early Ave
- 1075 E Early Ave
- 1045 E Early Ave
- 1006 E Duff Ave
- 1120 E Duff Ave
- 1109 E Early Ave
- 1031 E Early Ave
- 992 E Duff Ave
- 1139 E Early Ave
- 1140 E Duff Ave
- 991 E Early Ave
- 1145 E Early Ave
- 962 E Duff Ave
- 1072 E Early Ave
- 1042 E Early Ave
Your Personal Tour Guide
Ask me questions while you tour the home.