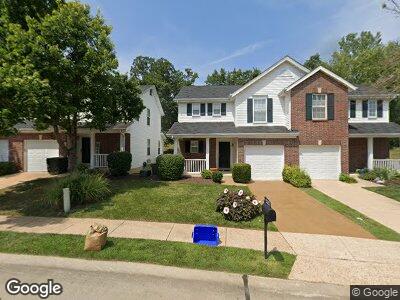
1063 Big Bend Crossing Dr Unit 170 Valley Park, MO 63088
Estimated Value: $250,000 - $258,965
2
Beds
3
Baths
1,382
Sq Ft
$185/Sq Ft
Est. Value
About This Home
This home is located at 1063 Big Bend Crossing Dr Unit 170, Valley Park, MO 63088 and is currently estimated at $255,491, approximately $184 per square foot. 1063 Big Bend Crossing Dr Unit 170 is a home located in St. Louis County with nearby schools including Valley Park Middle School, Twin Oaks Christian School, and Al Manara Academy.
Ownership History
Date
Name
Owned For
Owner Type
Purchase Details
Closed on
Sep 4, 2024
Sold by
Mary Keen Living Trust and Keen Mary
Bought by
Mueller Eric
Current Estimated Value
Home Financials for this Owner
Home Financials are based on the most recent Mortgage that was taken out on this home.
Original Mortgage
$255,373
Outstanding Balance
$253,802
Interest Rate
6.73%
Mortgage Type
VA
Estimated Equity
$1,689
Purchase Details
Closed on
Aug 3, 2011
Sold by
Keen Mary F
Bought by
Keen Mary and The Mary Keen Living Trust
Purchase Details
Closed on
Mar 2, 2001
Sold by
Penfold James R
Bought by
Keen Mary F
Home Financials for this Owner
Home Financials are based on the most recent Mortgage that was taken out on this home.
Original Mortgage
$76,900
Interest Rate
6.81%
Purchase Details
Closed on
Sep 30, 1999
Sold by
Schaefer Jeffrey C
Bought by
Penfold James R
Home Financials for this Owner
Home Financials are based on the most recent Mortgage that was taken out on this home.
Original Mortgage
$133,000
Interest Rate
6.75%
Create a Home Valuation Report for This Property
The Home Valuation Report is an in-depth analysis detailing your home's value as well as a comparison with similar homes in the area
Home Values in the Area
Average Home Value in this Area
Purchase History
| Date | Buyer | Sale Price | Title Company |
|---|---|---|---|
| Mueller Eric | -- | Freedom Title | |
| Keen Mary | -- | None Available | |
| Keen Mary F | $146,900 | -- | |
| Keen Mary F | -- | -- | |
| Penfold James R | $140,500 | -- |
Source: Public Records
Mortgage History
| Date | Status | Borrower | Loan Amount |
|---|---|---|---|
| Open | Mueller Eric | $255,373 | |
| Previous Owner | Keen Mary F | $76,900 | |
| Previous Owner | Penfold James R | $133,000 |
Source: Public Records
Tax History Compared to Growth
Tax History
| Year | Tax Paid | Tax Assessment Tax Assessment Total Assessment is a certain percentage of the fair market value that is determined by local assessors to be the total taxable value of land and additions on the property. | Land | Improvement |
|---|---|---|---|---|
| 2023 | $3,450 | $41,120 | $9,410 | $31,710 |
| 2022 | $3,494 | $37,770 | $11,970 | $25,800 |
| 2021 | $3,481 | $37,770 | $11,970 | $25,800 |
| 2020 | $3,407 | $35,330 | $7,700 | $27,630 |
| 2019 | $3,277 | $35,330 | $7,700 | $27,630 |
| 2018 | $2,851 | $30,250 | $5,130 | $25,120 |
| 2017 | $2,755 | $30,250 | $5,130 | $25,120 |
| 2016 | $2,632 | $26,720 | $5,990 | $20,730 |
| 2015 | $2,583 | $26,720 | $5,990 | $20,730 |
| 2014 | $2,650 | $26,810 | $5,970 | $20,840 |
Source: Public Records
Map
Nearby Homes
- 1029 Arbor Pointe Dr
- 1038 Arbor Pointe Dr
- 1157 Arbor Place Dr
- 999 Century Oaks Dr
- 19 Big Bend Station Ct
- 1287 Big Bend Crossing Dr
- 3423 Charleston Place Ct
- 3425 Country Stone Manor Dr Unit H
- 3317 Lower Lakes Estates Dr
- 889 Almond Hill Ct
- 812 La Feil Dr
- 725 Highland Ave
- 740 Forest Ave
- 64 Crescent Ave
- 712 Carman Oaks Ct
- 1703 Blakefield Terrace
- 1218 Dorne Dr
- 1137 Great Falls Ct
- 78 Jefflyn Dr
- 733 La Bonne Pkwy
- 1063 Big Bend Crossing Dr Unit 170
- 1067 Big Bend Crossing Dr
- 1061 Big Bend Crossing Dr
- 1069 Big Bend Crossing Dr
- 1057 Big Bend Crossing Dr
- 1073 Big Bend Crossing Dr
- 1075 Big Bend Crossing Dr
- 1055 Big Bend Crossing Dr
- 1008 Arbor Pointe Dr
- 1006 Arbor Pointe Dr
- 1012 Arbor Pointe Dr
- 1014 Arbor Pointe Dr
- 1002 Arbor Pointe Dr
- 1064 Big Bend Crossing Dr
- 1051 Big Bend Crossing Dr
- 1105 Big Bend Crossing Dr
- 1049 Big Bend Crossing Dr
- 1018 Arbor Pointe Dr
- 1000 Arbor Pointe Dr
- 1066 Big Bend Crossing Dr