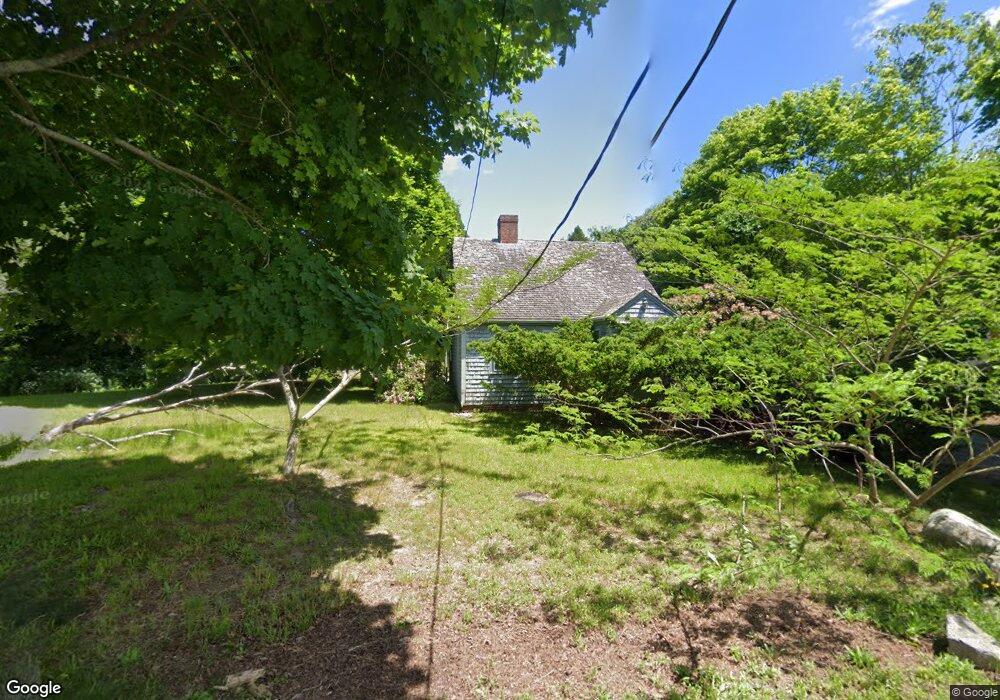
1064 Main St West Barnstable, MA 2668
West Barnstable NeighborhoodEstimated Value: $575,000 - $1,257,000
3
Beds
2
Baths
1,304
Sq Ft
$611/Sq Ft
Est. Value
About This Home
This home is located at 1064 Main St, West Barnstable, MA 2668 and is currently estimated at $796,812, approximately $611 per square foot. 1064 Main St is a home located in Barnstable County with nearby schools including West Barnstable Elementary School, Barnstable United Elementary School, and Barnstable Intermediate School.
Ownership History
Date
Name
Owned For
Owner Type
Purchase Details
Closed on
Oct 10, 2013
Sold by
Dow 3Rd James A and Dow James A
Bought by
Dow 4Th James A
Current Estimated Value
Purchase Details
Closed on
Jun 16, 1994
Sold by
Bornstein Exchange T 2
Bought by
Dow James A
Home Financials for this Owner
Home Financials are based on the most recent Mortgage that was taken out on this home.
Original Mortgage
$148,000
Interest Rate
8.5%
Mortgage Type
Purchase Money Mortgage
Purchase Details
Closed on
Jan 30, 1992
Sold by
Old Kings Court Rt
Bought by
Bornstein Stuart
Create a Home Valuation Report for This Property
The Home Valuation Report is an in-depth analysis detailing your home's value as well as a comparison with similar homes in the area
Home Values in the Area
Average Home Value in this Area
Purchase History
| Date | Buyer | Sale Price | Title Company |
|---|---|---|---|
| Dow 4Th James A | -- | -- | |
| Dow James A | $187,000 | -- | |
| Bornstein Stuart | $135,000 | -- |
Source: Public Records
Mortgage History
| Date | Status | Borrower | Loan Amount |
|---|---|---|---|
| Previous Owner | Bornstein Stuart | $148,000 | |
| Previous Owner | Bornstein Stuart | $158,274 |
Source: Public Records
Tax History
| Year | Tax Paid | Tax Assessment Tax Assessment Total Assessment is a certain percentage of the fair market value that is determined by local assessors to be the total taxable value of land and additions on the property. | Land | Improvement |
|---|---|---|---|---|
| 2025 | $5,754 | $616,100 | $300,000 | $316,100 |
| 2024 | $5,154 | $600,700 | $300,000 | $300,700 |
| 2023 | $5,173 | $567,800 | $296,900 | $270,900 |
| 2022 | $4,734 | $426,100 | $190,200 | $235,900 |
| 2021 | $4,813 | $410,700 | $202,100 | $208,600 |
| 2020 | $5,060 | $417,500 | $228,200 | $189,300 |
| 2019 | $5,084 | $414,000 | $240,800 | $173,200 |
| 2018 | $4,910 | $396,300 | $240,100 | $156,200 |
| 2017 | $4,763 | $389,100 | $246,800 | $142,300 |
| 2016 | $4,747 | $395,900 | $253,600 | $142,300 |
| 2015 | $4,582 | $383,100 | $235,100 | $148,000 |
Source: Public Records
Map
Nearby Homes
- 27 White Cap Ln
- 282 Parker Rd
- 350 Plum St
- 26 Carlson Ln
- 29 Appaloosa Way
- 74 Saddler Ln
- 34 Black Duck Ln
- 324 Patriot Way
- 11 Shepherds Way
- 80 Branch Terrace
- 1028 Old Falmouth Rd
- 2656 Main St
- 157 Scudder's Ln
- 3 Mulberry Cir
- 900 Old Stage Rd
- 87 Foxglove Rd
- 817 Race Ln
- 6 Harpers Hollow
- 817 Race Ln
- 66 Tern Ln
- 1040 Main St
- 1084 Main St
- 1050 Main St
- 1071 Main St
- 1094 Main St
- 1090 Main St
- 1022 Route 6a
- 1022 Massachusetts 6a
- 1022 Main St Route 6a
- 1022 Main St
- 1022 Main St
- 29 Packet Landing Way
- 41 Packet Landing Way
- 1025 Main St Unit 2
- 1025 Main St Unit B
- 1025 Main St Unit 2D
- 1025 Main St
- 1025 Main St
- 1106 Main St
Your Personal Tour Guide
Ask me questions while you tour the home.