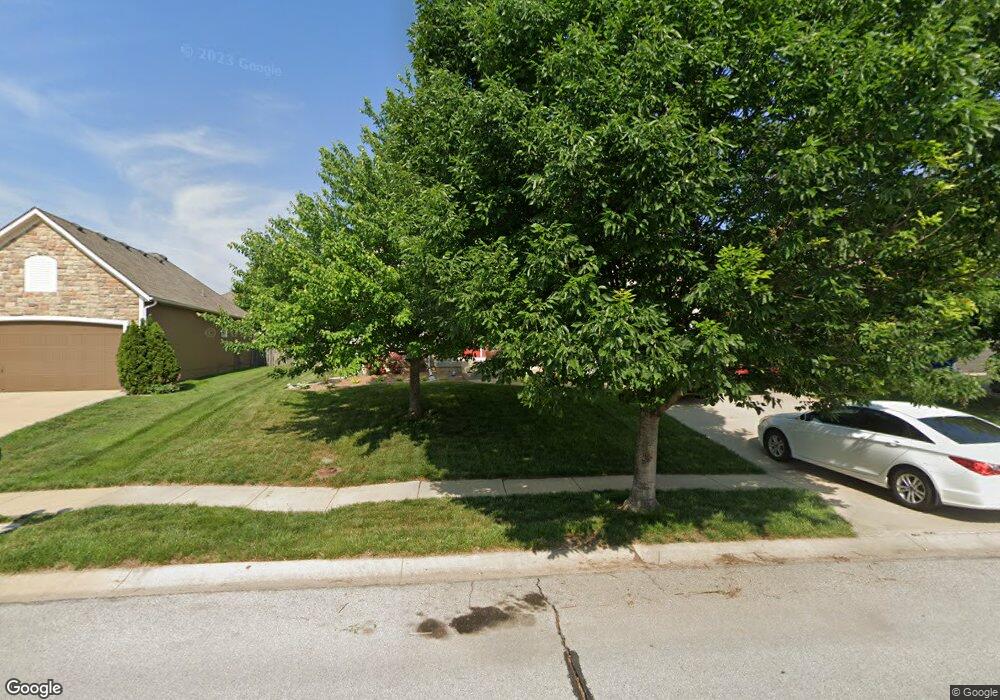
10654 S Langley St Olathe, KS 66061
Estimated Value: $490,609 - $540,000
4
Beds
3
Baths
2,117
Sq Ft
$243/Sq Ft
Est. Value
About This Home
This home is located at 10654 S Langley St, Olathe, KS 66061 and is currently estimated at $514,652, approximately $243 per square foot. 10654 S Langley St is a home located in Johnson County with nearby schools including Meadow Lane Elementary School, Prairie Trail Middle School, and Olathe Northwest High School.
Ownership History
Date
Name
Owned For
Owner Type
Purchase Details
Closed on
Oct 11, 2011
Sold by
Schue Jeremy and Schue Jennifer
Bought by
Norenberg Steven E and Norenberg Melissa A
Current Estimated Value
Home Financials for this Owner
Home Financials are based on the most recent Mortgage that was taken out on this home.
Original Mortgage
$176,000
Outstanding Balance
$120,212
Interest Rate
4.13%
Mortgage Type
New Conventional
Estimated Equity
$394,440
Purchase Details
Closed on
Oct 20, 2006
Sold by
Three Women And A Fountain L L C
Bought by
Schue Jeremy and Jeziorski Jennifer
Home Financials for this Owner
Home Financials are based on the most recent Mortgage that was taken out on this home.
Original Mortgage
$260,451
Interest Rate
6.25%
Mortgage Type
Adjustable Rate Mortgage/ARM
Purchase Details
Closed on
Nov 15, 2005
Sold by
Brookview Investments Llc
Bought by
Three Women An Da Fountain Llc
Create a Home Valuation Report for This Property
The Home Valuation Report is an in-depth analysis detailing your home's value as well as a comparison with similar homes in the area
Home Values in the Area
Average Home Value in this Area
Purchase History
| Date | Buyer | Sale Price | Title Company |
|---|---|---|---|
| Norenberg Steven E | -- | First United Title Agency | |
| Schue Jeremy | -- | Homestead Title | |
| Three Women An Da Fountain Llc | -- | Homestead Title |
Source: Public Records
Mortgage History
| Date | Status | Borrower | Loan Amount |
|---|---|---|---|
| Open | Norenberg Steven E | $176,000 | |
| Previous Owner | Schue Jeremy | $260,451 |
Source: Public Records
Tax History Compared to Growth
Tax History
| Year | Tax Paid | Tax Assessment Tax Assessment Total Assessment is a certain percentage of the fair market value that is determined by local assessors to be the total taxable value of land and additions on the property. | Land | Improvement |
|---|---|---|---|---|
| 2024 | $5,942 | $52,509 | $10,827 | $41,682 |
| 2023 | $5,889 | $51,152 | $9,410 | $41,742 |
| 2022 | $5,018 | $42,470 | $8,186 | $34,284 |
| 2021 | $4,754 | $38,398 | $7,438 | $30,960 |
| 2020 | $4,835 | $38,686 | $7,438 | $31,248 |
| 2019 | $4,652 | $36,984 | $6,202 | $30,782 |
| 2018 | $4,295 | $33,925 | $6,202 | $27,723 |
| 2017 | $4,131 | $32,304 | $5,635 | $26,669 |
| 2016 | $3,679 | $29,532 | $4,898 | $24,634 |
| 2015 | $3,578 | $28,739 | $4,898 | $23,841 |
| 2013 | -- | $25,300 | $5,681 | $19,619 |
Source: Public Records
Map
Nearby Homes
- 19576 W 105th Terrace
- 20035 W 107th Terrace
- 20457 W 107th Terrace
- 10744 S Palisade St
- 9915 Brockway St
- Jefferson 1.5 EX Plan at Cedar Ridge Reserve - Cedar Ridge
- Augusta Ex Plan at Cedar Ridge Reserve - Cedar Ridge
- Augusta II Plan at Cedar Ridge Reserve - Cedar Ridge
- Riviera Plan at Cedar Ridge Reserve - Cedar Ridge
- Roosevelt SE Plan at Cedar Ridge Reserve - Cedar Ridge
- Fillmore Plan at Cedar Ridge Reserve - Cedar Ridge
- Augusta Plan at Cedar Ridge Reserve - Cedar Ridge
- Augusta V Plan at Cedar Ridge Reserve - Cedar Ridge
- Jefferson III Plan at Cedar Ridge Reserve - Cedar Ridge
- Fremont Plan at Cedar Ridge Reserve - Cedar Ridge
- Eastwood Ex Plan at Cedar Ridge Reserve - Cedar Ridge
- Truman Plan at Cedar Ridge Reserve - Cedar Ridge
- Madison II Plan at Cedar Ridge Reserve - Cedar Ridge
- Firethorn Plan at Cedar Ridge Reserve - Cedar Ridge
- Hamilton 3 Car SE Plan at Cedar Ridge Reserve - Cedar Ridge
- 10646 S Langley St
- 10662 S Langley St
- 19766 W 106th Terrace
- 10661 S Emerald St
- 10638 S Langley St
- 19685 W 106th Terrace
- 19786 W 106th Terrace
- 10653 S Emerald St
- 19686 W 106th Terrace
- 10671 S Langley St
- 19717 W 105th Terrace
- 19735 W 106th Terrace
- 19755 W 106th Terrace
- 19737 W 105th Terrace
- 19663 W 106th Terrace
- 10669 S Emerald St
- 10679 S Langley St
- 19775 W 106th Terrace
- 19664 W 106th Terrace
- 10645 S Emerald St