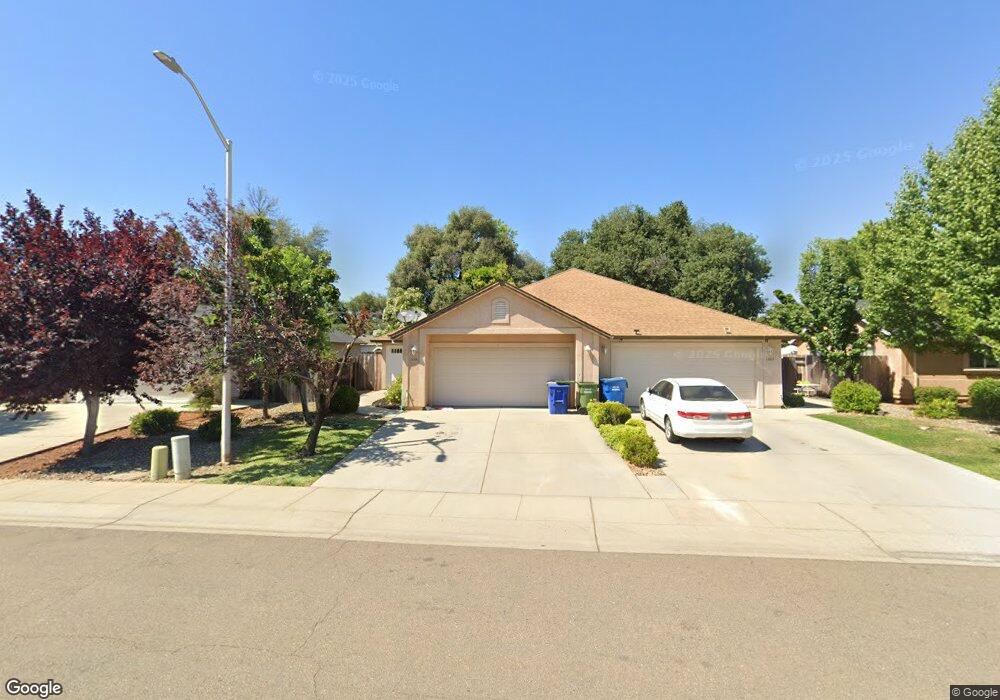
1066 Monterra Ln Redding, CA 96002
Enterprise NeighborhoodEstimated Value: $466,857 - $625,000
2
Beds
2
Baths
2,560
Sq Ft
$210/Sq Ft
Est. Value
About This Home
This home is located at 1066 Monterra Ln, Redding, CA 96002 and is currently estimated at $537,214, approximately $209 per square foot. 1066 Monterra Ln is a home located in Shasta County with nearby schools including Lassen View Elementary School, Parsons Junior High School, and Enterprise High School.
Ownership History
Date
Name
Owned For
Owner Type
Purchase Details
Closed on
Jun 11, 2024
Sold by
Lammers Trust and Lammers Prudence
Bought by
Rwl Gst Exemption Trust and Lammers
Current Estimated Value
Purchase Details
Closed on
Apr 27, 2019
Sold by
Hagerty Thomas A and Bahr Jeffrey D
Bought by
Lammers Robert W and Lammers Prudence
Purchase Details
Closed on
Nov 16, 2007
Sold by
Hagerty Thomas
Bought by
Hagerty Thomas A and Bahr Jeffrey D
Purchase Details
Closed on
Apr 6, 2006
Sold by
Red Rock Investments
Bought by
Hagerty Thomas
Home Financials for this Owner
Home Financials are based on the most recent Mortgage that was taken out on this home.
Original Mortgage
$297,500
Interest Rate
6.36%
Mortgage Type
Fannie Mae Freddie Mac
Create a Home Valuation Report for This Property
The Home Valuation Report is an in-depth analysis detailing your home's value as well as a comparison with similar homes in the area
Home Values in the Area
Average Home Value in this Area
Purchase History
| Date | Buyer | Sale Price | Title Company |
|---|---|---|---|
| Rwl Gst Exemption Trust | -- | None Listed On Document | |
| Lammers Robert W | $393,000 | First American Title Company | |
| Hagerty Thomas A | -- | None Available | |
| Hagerty Thomas | $425,000 | First American Title Co |
Source: Public Records
Mortgage History
| Date | Status | Borrower | Loan Amount |
|---|---|---|---|
| Previous Owner | Hagerty Thomas | $297,500 |
Source: Public Records
Tax History
| Year | Tax Paid | Tax Assessment Tax Assessment Total Assessment is a certain percentage of the fair market value that is determined by local assessors to be the total taxable value of land and additions on the property. | Land | Improvement |
|---|---|---|---|---|
| 2025 | $5,013 | $438,393 | $89,238 | $349,155 |
| 2024 | $4,914 | $429,798 | $87,489 | $342,309 |
| 2023 | $4,914 | $421,372 | $85,774 | $335,598 |
| 2022 | $4,757 | $413,111 | $84,093 | $329,018 |
| 2021 | $4,584 | $405,012 | $82,445 | $322,567 |
| 2020 | $4,536 | $400,860 | $81,600 | $319,260 |
| 2019 | $4,512 | $390,000 | $80,000 | $310,000 |
| 2018 | $4,381 | $375,000 | $60,000 | $315,000 |
| 2017 | $4,345 | $350,000 | $60,000 | $290,000 |
| 2016 | $3,020 | $260,000 | $50,000 | $210,000 |
| 2015 | $2,839 | $245,000 | $50,000 | $195,000 |
| 2014 | $2,597 | $225,000 | $40,000 | $185,000 |
Source: Public Records
Map
Nearby Homes
- 4020 Churn Creek Rd
- 1354 Harpole Rd
- 3759 Alma Ave
- 1513 Harpole Rd
- 4302 Paulson Ln
- 4323 Churn Crk Rd
- 1397 Empress Ln
- 751 Woodacre Dr
- 737 Estate St
- 688 Julie Way
- 3527 Adams Ln
- 3360 Lawrence Rd
- 3708 Traverse St
- 607 Woodacre Dr
- 3540 Ricardo Ave
- 3689 Suzanne Way
- 1289 Arizona St
- 1091 Del Sol Place
- 4724 Squirrel Run Ct
- 1827 Bembow Dr
- 1066&1068 Monterra
- 1070 Monterra Ln
- 1060 Monterra Ln
- 1072 Monterra Ln
- 1076 Monterra Ln
- 1056 Monterra Ln
- 1195 de Moll Dr
- 1078 Monterra Ln
- 1189 de Moll Dr
- Lot 5 Monterra Ln
- 1203 de Moll Dr
- 1069 Monterra Ln
- 1179 de Moll Dr
- 1050 Monterra Ln
- 1075 Monterra Ln
- 1063 Monterra Ln
- 1084 Monterra Ln
- 1081 Monterra Ln
- 1057 Monterra Ln
- 1169 de Moll Dr
Your Personal Tour Guide
Ask me questions while you tour the home.