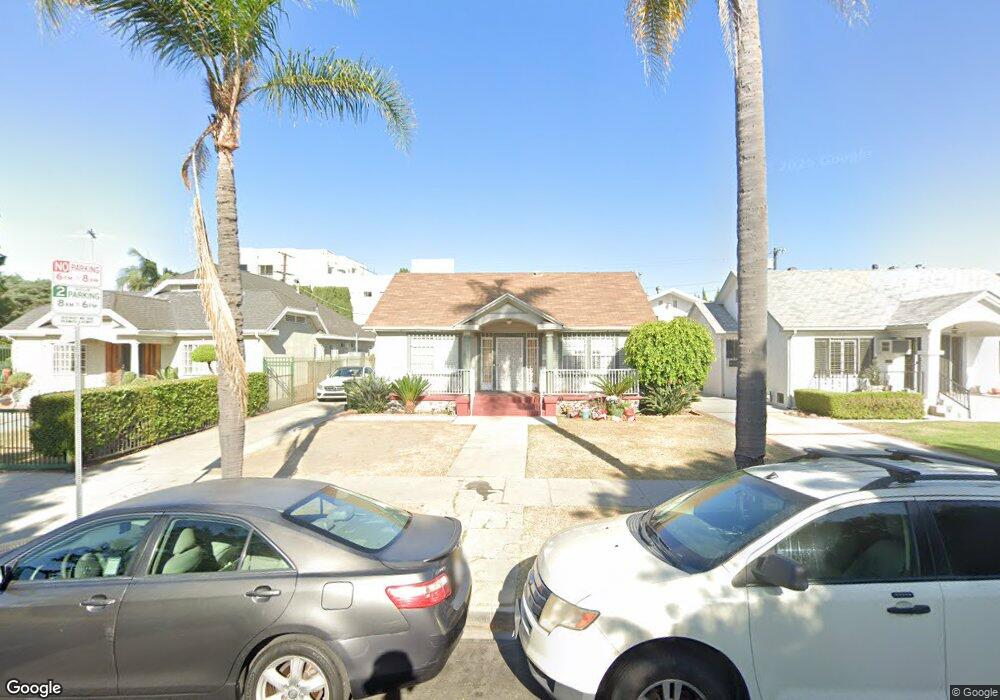
1067 5th Ave Los Angeles, CA 90019
Arlington Heights NeighborhoodEstimated Value: $955,275 - $1,488,000
2
Beds
1
Bath
1,255
Sq Ft
$1,017/Sq Ft
Est. Value
About This Home
This home is located at 1067 5th Ave, Los Angeles, CA 90019 and is currently estimated at $1,276,319, approximately $1,016 per square foot. 1067 5th Ave is a home located in Los Angeles County with nearby schools including Queen Anne Place Elementary, Pio Pico Middle School, and Los Angeles Senior High School.
Ownership History
Date
Name
Owned For
Owner Type
Purchase Details
Closed on
Jun 24, 2008
Sold by
Muro Jane J
Bought by
Muro Jane J
Current Estimated Value
Home Financials for this Owner
Home Financials are based on the most recent Mortgage that was taken out on this home.
Original Mortgage
$544,185
Outstanding Balance
$313,295
Interest Rate
4.12%
Mortgage Type
Reverse Mortgage Home Equity Conversion Mortgage
Estimated Equity
$963,024
Purchase Details
Closed on
May 5, 2008
Sold by
Mora Raul
Bought by
Mora Lola P
Home Financials for this Owner
Home Financials are based on the most recent Mortgage that was taken out on this home.
Original Mortgage
$544,185
Outstanding Balance
$313,295
Interest Rate
4.12%
Mortgage Type
Reverse Mortgage Home Equity Conversion Mortgage
Estimated Equity
$963,024
Purchase Details
Closed on
May 13, 1998
Sold by
Mora Segundo M
Bought by
Mora Raul and Mora Jaime
Create a Home Valuation Report for This Property
The Home Valuation Report is an in-depth analysis detailing your home's value as well as a comparison with similar homes in the area
Home Values in the Area
Average Home Value in this Area
Purchase History
| Date | Buyer | Sale Price | Title Company |
|---|---|---|---|
| Muro Jane J | -- | Lenders Choice Title Company | |
| Mora Lola P | -- | None Available | |
| Muro Jane J | -- | None Available | |
| Mora Raul | -- | -- |
Source: Public Records
Mortgage History
| Date | Status | Borrower | Loan Amount |
|---|---|---|---|
| Open | Muro Jane J | $544,185 |
Source: Public Records
Tax History Compared to Growth
Tax History
| Year | Tax Paid | Tax Assessment Tax Assessment Total Assessment is a certain percentage of the fair market value that is determined by local assessors to be the total taxable value of land and additions on the property. | Land | Improvement |
|---|---|---|---|---|
| 2025 | $1,830 | $130,974 | $67,894 | $63,080 |
| 2024 | $1,830 | $128,407 | $66,563 | $61,844 |
| 2023 | $1,804 | $125,890 | $65,258 | $60,632 |
| 2022 | $1,734 | $123,423 | $63,979 | $59,444 |
| 2021 | $1,704 | $121,004 | $62,725 | $58,279 |
| 2019 | $1,659 | $117,416 | $60,865 | $56,551 |
| 2018 | $1,504 | $115,115 | $59,672 | $55,443 |
| 2016 | $1,428 | $110,646 | $57,355 | $53,291 |
| 2015 | $1,408 | $108,985 | $56,494 | $52,491 |
| 2014 | $1,423 | $106,851 | $55,388 | $51,463 |
Source: Public Records
Map
Nearby Homes
- 1046 S Norton Ave
- 1121 5th Ave
- 1125 3rd Ave
- 1215 5th Ave
- 1153 S Bronson Ave
- 1206 3rd Ave
- 1235 3rd Ave
- 971 3rd Ave
- 1130 Westchester Place
- 1250 5th Ave
- 1053 S Victoria Ave
- 1183 Crenshaw Blvd
- 1187 Crenshaw Blvd Unit 1-8
- 3714 W Pico Blvd
- 1152 S Windsor Blvd
- 907 Westchester Place
- 830 S Norton Ave
- 1406 3rd Ave
- 1406 2nd Ave
- 851 Crenshaw Blvd
- 1061 5th Ave
- 1073 5th Ave
- 1055 5th Ave
- 3819 Country Club Dr
- 3819 Country Club Dr
- 3819 Country Club Dr Unit 102
- 3819 Country Club Dr Unit PH302
- 3819 Country Club Dr Unit 203
- 3819 Country Club Dr Unit 204
- 3819 Country Club Dr Unit 103
- 1051 5th Ave
- 1068 5th Ave
- 1062 5th Ave
- 1068 S Norton Ave
- 1056 S Norton Ave
- 1045 5th Ave
- 1072 S Norton Ave
- 1056 5th Ave
- 1100 5th Ave
- 3800 Country Club Dr Unit 12