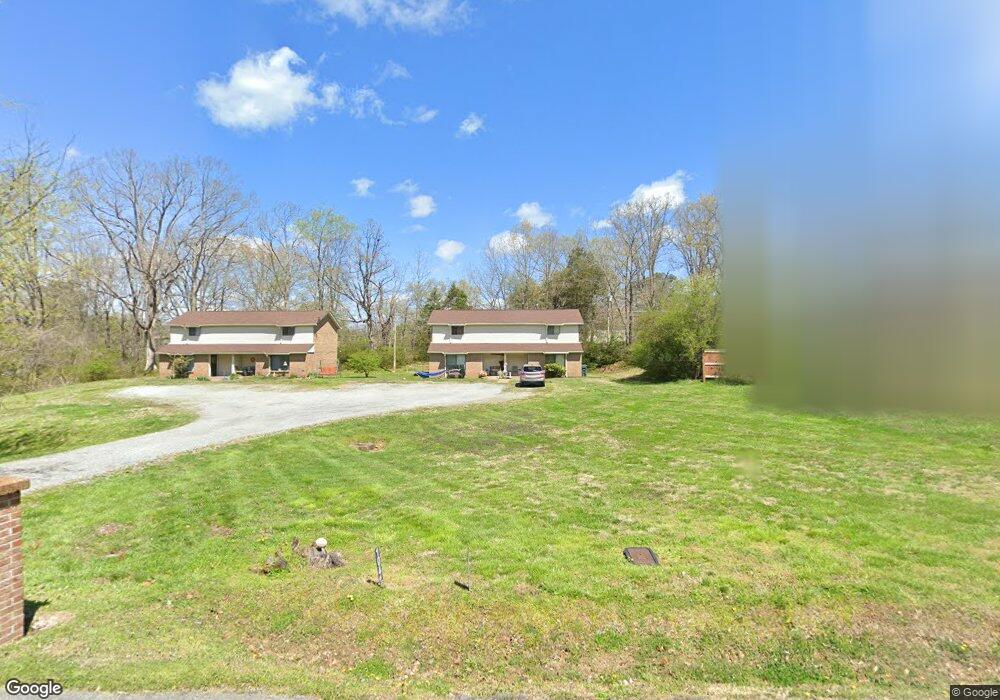
106D Nesbitt St Unit 106C Dickson, TN 37055
Estimated Value: $447,000 - $507,000
--
Bed
3
Baths
2,322
Sq Ft
$205/Sq Ft
Est. Value
About This Home
This home is located at 106D Nesbitt St Unit 106C, Dickson, TN 37055 and is currently estimated at $477,000, approximately $205 per square foot. 106D Nesbitt St Unit 106C is a home located in Dickson County with nearby schools including Centennial Elementary School, Dickson Middle School, and Dickson County High School.
Ownership History
Date
Name
Owned For
Owner Type
Purchase Details
Closed on
May 14, 1999
Sold by
Armstrong Jon R and Springer Anthony
Bought by
Equity Properties
Current Estimated Value
Purchase Details
Closed on
Aug 31, 1994
Bought by
Armstrong Jon R and Armstrong Charlotte Ann
Purchase Details
Closed on
Aug 8, 1994
Bought by
Smith Jerry V
Purchase Details
Closed on
Sep 21, 1987
Bought by
Smith Jerry V and Smith Fuqua B
Purchase Details
Closed on
Sep 8, 1980
Bought by
Moore Anthony T
Purchase Details
Closed on
Jun 16, 1980
Create a Home Valuation Report for This Property
The Home Valuation Report is an in-depth analysis detailing your home's value as well as a comparison with similar homes in the area
Home Values in the Area
Average Home Value in this Area
Purchase History
| Date | Buyer | Sale Price | Title Company |
|---|---|---|---|
| Equity Properties | $200,000 | -- | |
| Armstrong Jon R | $120,000 | -- | |
| Smith Jerry V | $1,000 | -- | |
| Smith Jerry V | $120,000 | -- | |
| Moore Anthony T | -- | -- | |
| -- | -- | -- |
Source: Public Records
Tax History Compared to Growth
Tax History
| Year | Tax Paid | Tax Assessment Tax Assessment Total Assessment is a certain percentage of the fair market value that is determined by local assessors to be the total taxable value of land and additions on the property. | Land | Improvement |
|---|---|---|---|---|
| 2025 | -- | $96,840 | $0 | $0 |
| 2024 | -- | $96,840 | $14,440 | $82,400 |
| 2023 | $2,206 | $70,640 | $12,440 | $58,200 |
| 2022 | $2,206 | $70,640 | $12,440 | $58,200 |
| 2021 | $2,206 | $70,640 | $12,440 | $58,200 |
| 2020 | $2,206 | $70,640 | $12,440 | $58,200 |
| 2019 | $2,206 | $70,640 | $12,440 | $58,200 |
| 2018 | $1,919 | $52,600 | $11,200 | $41,400 |
| 2017 | $1,919 | $52,600 | $11,200 | $41,400 |
| 2016 | $1,919 | $52,600 | $11,200 | $41,400 |
| 2015 | $2,040 | $52,600 | $11,200 | $41,400 |
| 2014 | $2,040 | $52,600 | $11,200 | $41,400 |
Source: Public Records
Map
Nearby Homes
- 110 Mccreary Heights
- 213 Mccreary Heights
- 414 W College St
- 303 W College St
- 0 Rocky Dr Unit RTC2761527
- 119 Oak Dr
- 0 Tucker Rd Unit RTC3051077
- 205 Oak Dr
- 701 W 5th St
- 121 Sylvis St
- 500 Church St
- 212 Sylvis St
- 805 W 2nd St
- 129 Ironhorse Way
- 308 E Railroad St
- 909 W 1st St
- 0 Hardin Ave
- 210 Hardin Ave
- 430 Center Ave
- 0 W Walnut St
- 104 Nesbitt St Unit 104A
- 102 Nesbitt St
- 409 Murrell St
- 101 Nesbitt St
- 407 Murrell St
- 411 Murrell St
- 114 Nesbitt St
- 100 Reeves St
- 103 Reeves St
- 201 Mccreary Heights
- 207 Mccreary Heights
- 211 Mccreary Heights
- 103 Nesbitt St
- 405 Murrell St
- 112 Mccreary Heights
- 412 Murrell St
- 408 Murrell St
- 215 Mccreary Heights
- 414 Murrell St
- 406 Murrell St