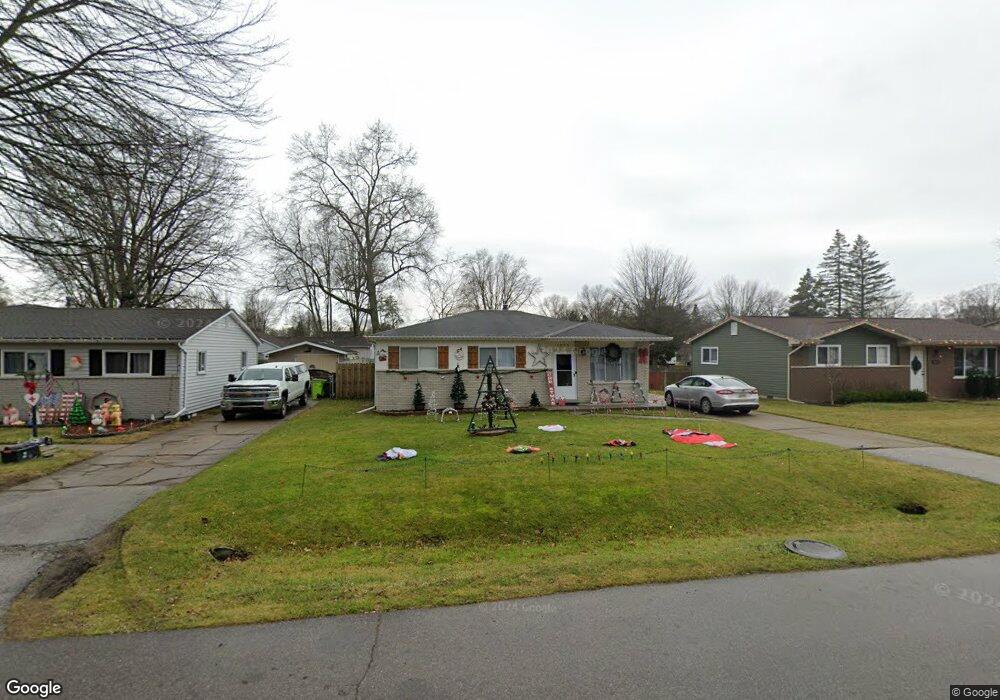
1073 Summer St Algonac, MI 48001
Estimated Value: $159,000 - $222,000
3
Beds
1
Bath
1,334
Sq Ft
$145/Sq Ft
Est. Value
About This Home
This home is located at 1073 Summer St, Algonac, MI 48001 and is currently estimated at $192,943, approximately $144 per square foot. 1073 Summer St is a home located in St. Clair County.
Ownership History
Date
Name
Owned For
Owner Type
Purchase Details
Closed on
Aug 15, 2023
Sold by
Alicia Szczecinski Llc
Bought by
Coltman Patricia and Coltman Scott
Current Estimated Value
Home Financials for this Owner
Home Financials are based on the most recent Mortgage that was taken out on this home.
Original Mortgage
$8,690
Outstanding Balance
$8,471
Interest Rate
6.71%
Estimated Equity
$184,472
Purchase Details
Closed on
Jul 24, 2023
Sold by
Alicia Szczecinski Llc
Bought by
Coltman Patricia and Coltman Scott
Home Financials for this Owner
Home Financials are based on the most recent Mortgage that was taken out on this home.
Original Mortgage
$8,690
Outstanding Balance
$8,471
Interest Rate
6.71%
Estimated Equity
$184,472
Purchase Details
Closed on
Sep 22, 2022
Sold by
Szczecinski Alicia A
Bought by
Alicia Szczecinski Llc
Purchase Details
Closed on
Apr 6, 2020
Sold by
Szczecinski Alicia A and Davey Alicia A
Bought by
Hubka Josephine I and Davey Alicia A
Purchase Details
Closed on
Oct 14, 2005
Sold by
Vanoast Bernard and Vanoast Van Oast
Bought by
Hubka Josephine I
Purchase Details
Closed on
Oct 10, 2005
Sold by
Hubka Josephine I
Bought by
Hubka Jopseph I and Davey Alicia A
Create a Home Valuation Report for This Property
The Home Valuation Report is an in-depth analysis detailing your home's value as well as a comparison with similar homes in the area
Home Values in the Area
Average Home Value in this Area
Purchase History
We collect this data history from publicly available records. To have your information removed, we recommend requesting removal directly through your county’s website.
| Date | Buyer | Sale Price | Title Company |
|---|---|---|---|
| Coltman Patricia | $182,000 | Premier Title | |
| Coltman Patricia | $182,000 | Premier Title | |
| Coltman Patricia | $182,000 | Premier Title | |
| Alicia Szczecinski Llc | -- | -- | |
| Hubka Josephine I | -- | None Available | |
| Hubka Josephine I | $115,000 | Bayshore Title Agency | |
| Hubka Jopseph I | -- | None Available |
Source: Public Records
Mortgage History
We collect this data history from publicly available records. To have your information removed, we recommend requesting removal directly through your county’s website.
| Date | Status | Borrower | Loan Amount |
|---|---|---|---|
| Open | Coltman Patricia | $8,690 | |
| Closed | Coltman Patricia | $8,690 | |
| Open | Coltman Patricia | $178,703 | |
| Closed | Coltman Patricia | $178,703 |
Source: Public Records
Tax History
| Year | Tax Paid | Tax Assessment Tax Assessment Total Assessment is a certain percentage of the fair market value that is determined by local assessors to be the total taxable value of land and additions on the property. | Land | Improvement |
|---|---|---|---|---|
| 2025 | $1,944 | $82,900 | $0 | $0 |
| 2024 | $2,879 | $75,900 | $0 | $0 |
| 2023 | $1,890 | $72,100 | $0 | $0 |
| 2022 | $1,910 | $65,600 | $0 | $0 |
| 2020 | $1,316 | $60,700 | $12,500 | $48,200 |
| 2019 | $1,299 | $52,300 | $0 | $0 |
| 2018 | $1,765 | $45,700 | $0 | $0 |
| 2017 | $3,029 | $39,700 | $0 | $0 |
| 2016 | $1,120 | $39,700 | $0 | $0 |
| 2015 | -- | $33,500 | $12,500 | $21,000 |
| 2014 | -- | $28,000 | $12,500 | $15,500 |
| 2013 | -- | $26,500 | $0 | $0 |
Source: Public Records
Map
Nearby Homes
- 1032 Summer St
- 918 Columbia St
- 9533 Amy Rd
- 1103 Beth Ct
- 829 Townsend Crescent W
- 711 Smith St
- 720 Washington St
- 2677 Pointe Tremble Rd
- 800 Ruskin Ave
- 710 Ruskin Ave
- 1523 Saint Clair River Dr
- 1609 Saint Clair River Dr
- 1720 Michigan St
- 1713 Saint Clair River Dr
- 1719 Saint Clair River Dr
- 0000 Lee St
- 408 Conley St
- 1516 Saint Clair River Dr
- 206 Edgewater Dr
- 1749 Saint Clair River Dr
Your Personal Tour Guide
Ask me questions while you tour the home.