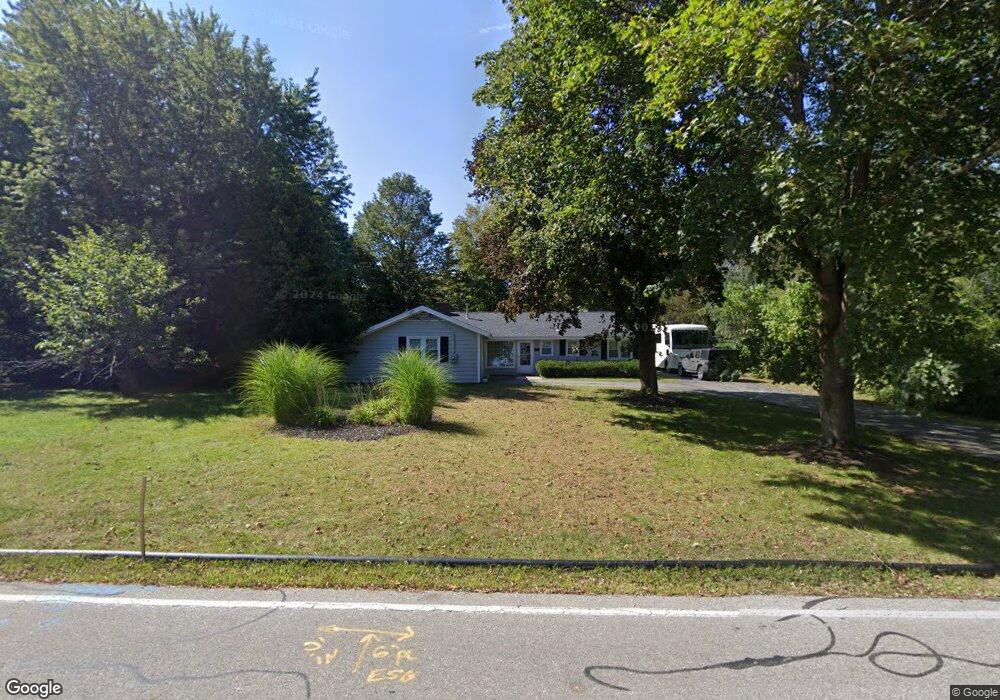
108 Argilla Rd Andover, MA 01810
West Andover NeighborhoodEstimated Value: $788,862 - $939,000
3
Beds
2
Baths
1,524
Sq Ft
$548/Sq Ft
Est. Value
About This Home
This home is located at 108 Argilla Rd, Andover, MA 01810 and is currently estimated at $835,466, approximately $548 per square foot. 108 Argilla Rd is a home located in Essex County with nearby schools including West Elementary School, Andover West Middle School, and Andover High School.
Ownership History
Date
Name
Owned For
Owner Type
Purchase Details
Closed on
May 31, 2016
Sold by
Macaux Eric W and Macaux Michelle W
Bought by
Forte Melissa K and Forte William H
Current Estimated Value
Home Financials for this Owner
Home Financials are based on the most recent Mortgage that was taken out on this home.
Original Mortgage
$327,600
Outstanding Balance
$259,401
Interest Rate
3.58%
Mortgage Type
New Conventional
Estimated Equity
$576,065
Purchase Details
Closed on
May 26, 2009
Sold by
Nyhan James C
Bought by
Macaux Eric W and Macaux Michelle W
Home Financials for this Owner
Home Financials are based on the most recent Mortgage that was taken out on this home.
Original Mortgage
$413,250
Interest Rate
4.93%
Mortgage Type
Purchase Money Mortgage
Purchase Details
Closed on
Jun 18, 2004
Sold by
Parshley Harold E
Bought by
Nyhan James C
Home Financials for this Owner
Home Financials are based on the most recent Mortgage that was taken out on this home.
Original Mortgage
$328,000
Interest Rate
6.12%
Mortgage Type
Purchase Money Mortgage
Create a Home Valuation Report for This Property
The Home Valuation Report is an in-depth analysis detailing your home's value as well as a comparison with similar homes in the area
Home Values in the Area
Average Home Value in this Area
Purchase History
| Date | Buyer | Sale Price | Title Company |
|---|---|---|---|
| Forte Melissa K | $455,000 | -- | |
| Macaux Eric W | $435,000 | -- | |
| Macaux Eric W | $435,000 | -- | |
| Nyhan James C | $410,000 | -- | |
| Nyhan James C | $410,000 | -- |
Source: Public Records
Mortgage History
| Date | Status | Borrower | Loan Amount |
|---|---|---|---|
| Open | Forte Melissa K | $327,600 | |
| Closed | Nyhan James C | $327,600 | |
| Previous Owner | Nyhan James C | $400,000 | |
| Previous Owner | Macaux Eric W | $413,250 | |
| Previous Owner | Nyhan James C | $328,000 |
Source: Public Records
Tax History
| Year | Tax Paid | Tax Assessment Tax Assessment Total Assessment is a certain percentage of the fair market value that is determined by local assessors to be the total taxable value of land and additions on the property. | Land | Improvement |
|---|---|---|---|---|
| 2024 | $9,466 | $734,900 | $532,400 | $202,500 |
| 2023 | $9,051 | $662,600 | $479,400 | $183,200 |
| 2022 | $8,401 | $575,400 | $417,000 | $158,400 |
| 2021 | $8,027 | $525,000 | $379,100 | $145,900 |
| 2020 | $7,697 | $512,800 | $370,000 | $142,800 |
| 2019 | $7,122 | $466,400 | $338,100 | $128,300 |
| 2018 | $6,933 | $443,300 | $325,000 | $118,300 |
| 2017 | $6,620 | $436,100 | $318,700 | $117,400 |
| 2016 | $6,463 | $436,100 | $318,700 | $117,400 |
| 2015 | $6,248 | $417,400 | $306,500 | $110,900 |
Source: Public Records
Map
Nearby Homes
- 11 Rennie Dr
- 241 Lowell St Unit 3
- 6 Exeter Way
- 1 Delisio Dr
- 54 Birch Rd
- 37 Crenshaw Ln Unit 37
- 31 Crenshaw Ln Unit 31
- 3 Caileigh Ct
- 105 Central St
- 40 Chandler Cir
- 11 Cuba St
- 20 Robert Dr Unit 20
- 12 Robert Dr Unit 12
- 3 Torr St
- 22 Railroad St Unit 504
- 25 Clubview Dr Unit 25
- 15 Geneva Rd
- 14 Geneva Rd
- 2 Powder Mill Square Unit 2B
- 1 Sweeney Ct
Your Personal Tour Guide
Ask me questions while you tour the home.