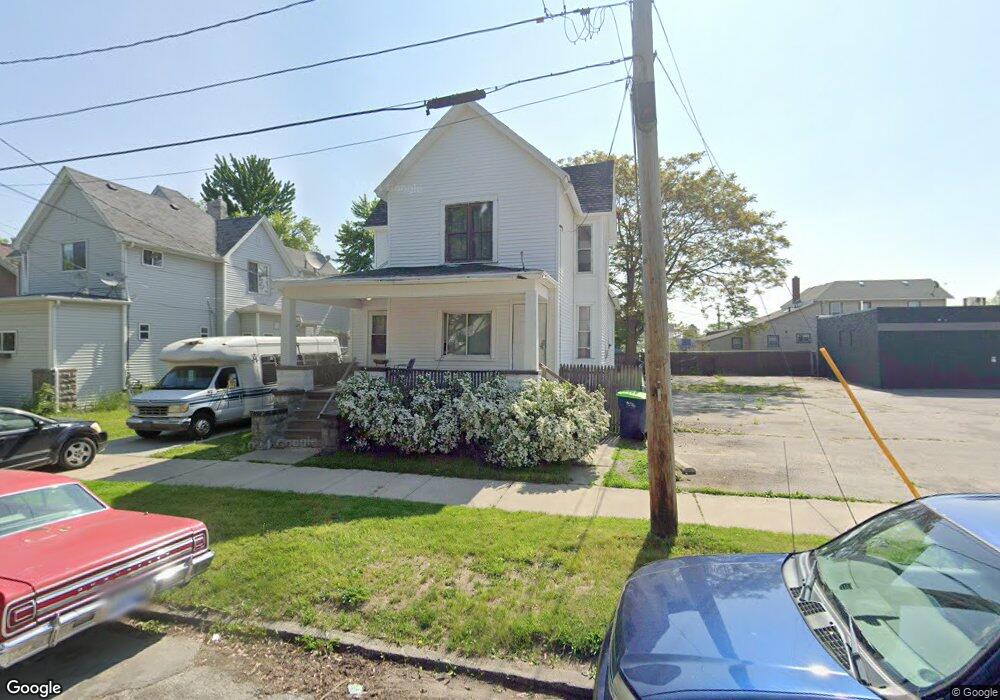
108 N Van Buren St Bay City, MI 48708
Estimated Value: $126,000 - $138,000
--
Bed
--
Bath
2,056
Sq Ft
$64/Sq Ft
Est. Value
About This Home
This home is located at 108 N Van Buren St, Bay City, MI 48708 and is currently estimated at $132,333, approximately $64 per square foot. 108 N Van Buren St is a home located in Bay County with nearby schools including Jumpertown High School, Wheeler High School, and Washington Elementary School.
Ownership History
Date
Name
Owned For
Owner Type
Purchase Details
Closed on
Aug 9, 2024
Sold by
Jw Remodeling Llc
Bought by
Jws Rentals Llc
Current Estimated Value
Home Financials for this Owner
Home Financials are based on the most recent Mortgage that was taken out on this home.
Original Mortgage
$268,500
Outstanding Balance
$265,456
Interest Rate
6.86%
Mortgage Type
New Conventional
Estimated Equity
-$133,123
Purchase Details
Closed on
May 31, 2023
Sold by
Tee Kay Oh Llc
Bought by
Jw Remodeling Llc
Home Financials for this Owner
Home Financials are based on the most recent Mortgage that was taken out on this home.
Original Mortgage
$82,900
Interest Rate
6.43%
Mortgage Type
Construction
Purchase Details
Closed on
Nov 12, 2014
Sold by
Cudney David R
Bought by
Creative Real Estate Solutions Llc
Create a Home Valuation Report for This Property
The Home Valuation Report is an in-depth analysis detailing your home's value as well as a comparison with similar homes in the area
Home Values in the Area
Average Home Value in this Area
Purchase History
| Date | Buyer | Sale Price | Title Company |
|---|---|---|---|
| Jws Rentals Llc | -- | Lighthouse Title Services | |
| Jw Remodeling Llc | $205,000 | Chicago Title | |
| Creative Real Estate Solutions Llc | -- | None Available |
Source: Public Records
Mortgage History
| Date | Status | Borrower | Loan Amount |
|---|---|---|---|
| Open | Jws Rentals Llc | $268,500 | |
| Previous Owner | Jw Remodeling Llc | $82,900 |
Source: Public Records
Tax History Compared to Growth
Tax History
| Year | Tax Paid | Tax Assessment Tax Assessment Total Assessment is a certain percentage of the fair market value that is determined by local assessors to be the total taxable value of land and additions on the property. | Land | Improvement |
|---|---|---|---|---|
| 2025 | $2,509 | $45,300 | $0 | $0 |
| 2024 | $2,150 | $37,650 | $0 | $0 |
| 2023 | $1,889 | $35,350 | $0 | $0 |
| 2022 | $2,188 | $31,850 | $0 | $0 |
| 2021 | $1,989 | $28,850 | $28,850 | $0 |
| 2020 | $1,623 | $25,400 | $25,400 | $0 |
| 2019 | $1,771 | $24,150 | $0 | $0 |
| 2018 | $1,571 | $23,350 | $0 | $0 |
| 2017 | $1,713 | $23,100 | $0 | $0 |
| 2016 | $1,747 | $24,000 | $0 | $24,000 |
| 2015 | $1,736 | $24,500 | $0 | $24,500 |
| 2014 | $1,736 | $37,350 | $0 | $37,350 |
Source: Public Records
Map
Nearby Homes
- 1010 13th St
- 224 N Madison Ave
- 509 11th St
- 301 N Van Buren St
- 208 S Sheridan St
- 302 N Farragut St
- 800 Mckinley St
- 701 15th St
- 1517 11th St
- 321 N Birney St
- 316 Fraser St
- 709 S Van Buren St
- 904 6th St
- 1010 6th Street 6th St
- 000 County Road 246 West Ave
- 501 S Mclellan St
- 714 S Madison Ave
- 309 Harold St
- 808 19th St
- 810 S Farragut St
- 114 N Van Buren St
- 905 Columbus Ave
- 909 Columbus Ave
- 118 N Van Buren St
- 109 N Grant St
- 915 Columbus Ave Unit 107 N Grant Street
- 915 Columbus Ave
- 113 N Grant St
- 113 N Van Buren St
- 111 N Van Buren St
- 117 N Van Buren St
- 119 N Van Buren St
- 115 N Grant St
- 200 N Van Buren St
- 915 11th St
- 201 N Van Buren St
- 1000 11th St
- 114 N Jackson St
- 805 11th St
- 104 S Van Buren St