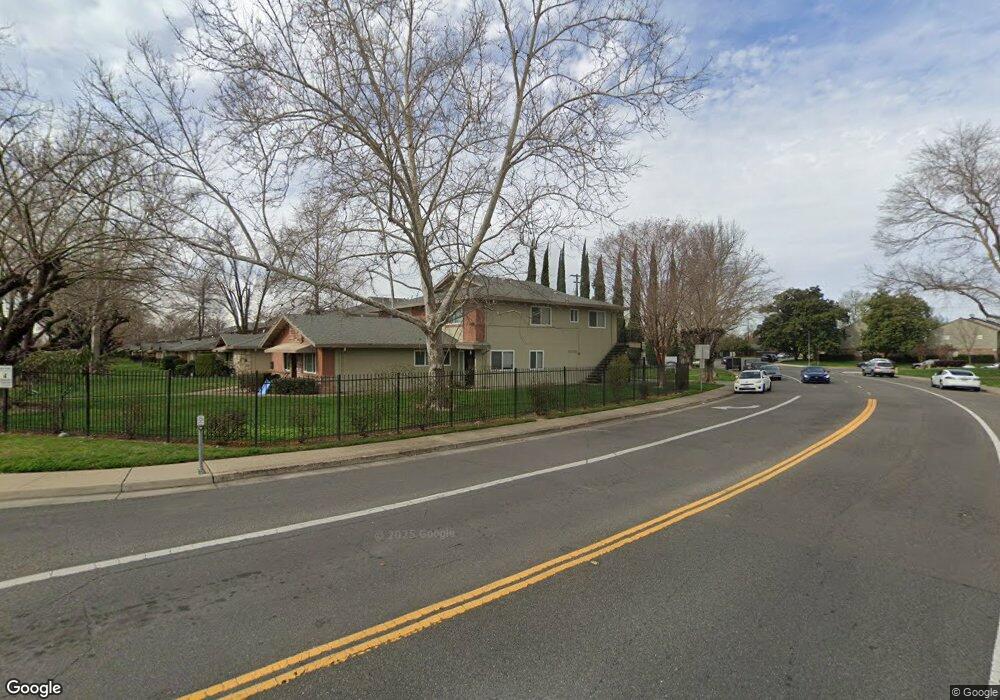
10839 Coloma Rd Unit 4 Rancho Cordova, CA 95670
Mills Ranch NeighborhoodEstimated Value: $188,000 - $220,000
2
Beds
1
Bath
924
Sq Ft
$224/Sq Ft
Est. Value
About This Home
This home is located at 10839 Coloma Rd Unit 4, Rancho Cordova, CA 95670 and is currently estimated at $206,966, approximately $223 per square foot. 10839 Coloma Rd Unit 4 is a home located in Sacramento County with nearby schools including Riverview STEM Elementary School, Peter J. Shields Elementary School, and W.E. Mitchell Middle School.
Ownership History
Date
Name
Owned For
Owner Type
Purchase Details
Closed on
Feb 19, 2021
Sold by
Anselmino Stephan
Bought by
Anselmino Stephen A and The Stephen Anselmino Trust
Current Estimated Value
Purchase Details
Closed on
Jul 13, 2010
Sold by
Citimortgage Inc
Bought by
Anselmino Stephan
Purchase Details
Closed on
May 14, 2010
Sold by
Gillmore Leah R
Bought by
Citimortgage Inc
Purchase Details
Closed on
Jun 12, 2003
Sold by
Kuykendall Wayne and Kuykendall Shirley
Bought by
Gillmore Leah R
Home Financials for this Owner
Home Financials are based on the most recent Mortgage that was taken out on this home.
Original Mortgage
$113,762
Interest Rate
5.61%
Mortgage Type
FHA
Create a Home Valuation Report for This Property
The Home Valuation Report is an in-depth analysis detailing your home's value as well as a comparison with similar homes in the area
Home Values in the Area
Average Home Value in this Area
Purchase History
| Date | Buyer | Sale Price | Title Company |
|---|---|---|---|
| Anselmino Stephen A | -- | None Available | |
| Anselmino Stephan | $41,000 | First American Title Insuran | |
| Citimortgage Inc | $47,000 | First American Title Company | |
| Gillmore Leah R | $116,500 | Stewart Title |
Source: Public Records
Mortgage History
| Date | Status | Borrower | Loan Amount |
|---|---|---|---|
| Previous Owner | Gillmore Leah R | $113,762 | |
| Closed | Gillmore Leah R | $6,000 |
Source: Public Records
Tax History Compared to Growth
Tax History
| Year | Tax Paid | Tax Assessment Tax Assessment Total Assessment is a certain percentage of the fair market value that is determined by local assessors to be the total taxable value of land and additions on the property. | Land | Improvement |
|---|---|---|---|---|
| 2025 | $681 | $52,515 | $25,617 | $26,898 |
| 2024 | $681 | $51,486 | $25,115 | $26,371 |
| 2023 | $667 | $50,477 | $24,623 | $25,854 |
| 2022 | $658 | $49,489 | $24,141 | $25,348 |
| 2021 | $645 | $48,519 | $23,668 | $24,851 |
| 2020 | $641 | $48,023 | $23,426 | $24,597 |
| 2019 | $630 | $47,082 | $22,967 | $24,115 |
| 2018 | $614 | $46,160 | $22,517 | $23,643 |
| 2017 | $599 | $45,256 | $22,076 | $23,180 |
| 2016 | $571 | $44,370 | $21,644 | $22,726 |
| 2015 | $543 | $43,704 | $21,319 | $22,385 |
| 2014 | $576 | $42,849 | $20,902 | $21,947 |
Source: Public Records
Map
Nearby Homes
- 10835 Coloma Rd Unit 3
- 10807 Coloma Rd Unit 4
- 10881 Coloma Rd Unit 1
- 2255 El Manto Dr
- 1912 Benita Dr Unit 1
- 1920 Benita Dr
- 2200 Kimwood Ln
- 2337 Benita Dr
- 2352 Sonata Dr
- 2329 Mcgregor Dr
- 2404 Coolidge Way
- 10825 Walnutwood Way
- 2413 Cordova Ln
- 2344 Rudat Cir
- 11100 Trinity River Dr
- 11150 Trinity River Dr Unit 41
- 11150 Trinity River Dr
- 11150 Trinity River Dr Unit 59
- 10583 Home Ranch Ct
- 259 Rocky Hills Ln
- 10839 Coloma Rd Unit 3
- 10839 Coloma Rd
- 10839 Coloma Rd Unit 1
- 10835 Coloma Rd Unit 2
- 10835 Coloma Rd Unit 4
- 10835 Coloma Rd Unit 1
- 10835 Coloma Rd
- 10831 Coloma Rd Unit 1
- 10831 Coloma Rd
- 10831 Coloma Rd Unit 2
- 10831 Coloma Rd Unit 4
- 10845 Coloma Rd
- 10845 Coloma Rd Unit 2
- 10845 Coloma Rd
- 10845 Coloma Rd Unit 4
- 10845 Coloma Rd Unit 2
- 10827 Coloma Rd Unit 2
- 10827 Coloma Rd Unit 4
- 10827 Coloma Rd Unit 1
- 10827 Coloma Rd