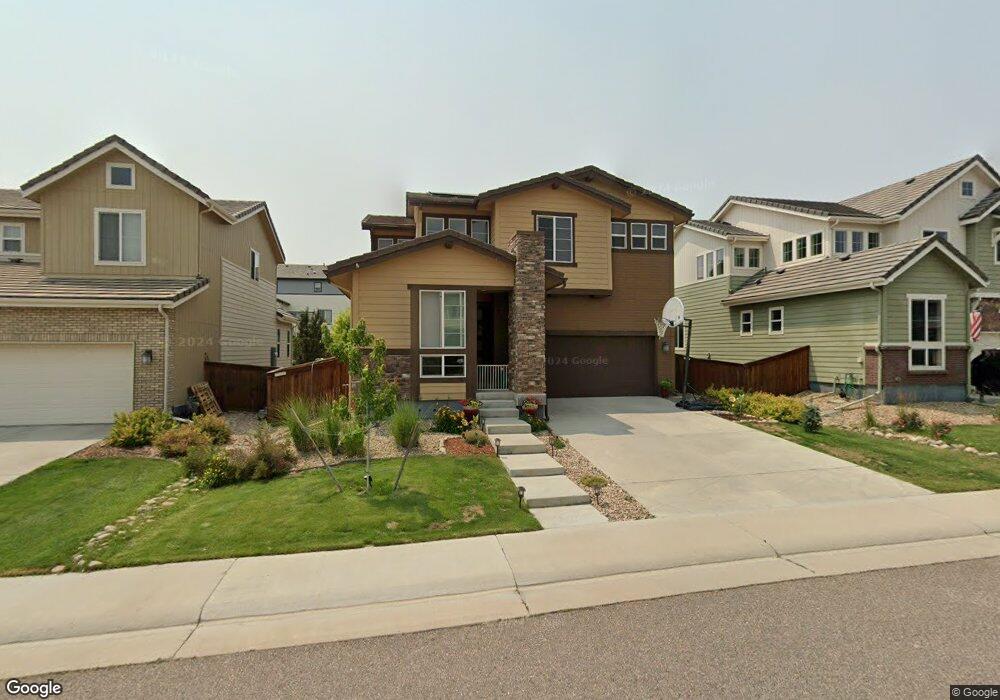
10863 Touchstone Loop Parker, CO 80134
Stepping Stone NeighborhoodEstimated Value: $669,598 - $724,000
3
Beds
3
Baths
2,197
Sq Ft
$318/Sq Ft
Est. Value
About This Home
This home is located at 10863 Touchstone Loop, Parker, CO 80134 and is currently estimated at $699,650, approximately $318 per square foot. 10863 Touchstone Loop is a home located in Douglas County with nearby schools including Prairie Crossing Elementary School, Sierra Middle School, and Chaparral High School.
Ownership History
Date
Name
Owned For
Owner Type
Purchase Details
Closed on
Mar 4, 2024
Sold by
Govindarajulu Mahender Nanduri and Namshagari Madhavi
Bought by
Nanduri Family Revocable Trust
Current Estimated Value
Purchase Details
Closed on
Jul 29, 2020
Sold by
Ajao Oyeniran and Ajao Helen
Bought by
Govindarajulu Mahender Nanduri and Namshagari Madhavi
Home Financials for this Owner
Home Financials are based on the most recent Mortgage that was taken out on this home.
Original Mortgage
$399,200
Interest Rate
3.1%
Mortgage Type
New Conventional
Purchase Details
Closed on
Mar 6, 2015
Sold by
Shea Homes Limited Partnership
Bought by
Ajao Oyeniran and Ajao Helen
Home Financials for this Owner
Home Financials are based on the most recent Mortgage that was taken out on this home.
Original Mortgage
$284,014
Interest Rate
3.6%
Mortgage Type
New Conventional
Create a Home Valuation Report for This Property
The Home Valuation Report is an in-depth analysis detailing your home's value as well as a comparison with similar homes in the area
Home Values in the Area
Average Home Value in this Area
Purchase History
| Date | Buyer | Sale Price | Title Company |
|---|---|---|---|
| Nanduri Family Revocable Trust | -- | None Listed On Document | |
| Govindarajulu Mahender Nanduri | -- | Land Title Guarantee Co | |
| Ajao Oyeniran | $355,018 | Fidelity National Title |
Source: Public Records
Mortgage History
| Date | Status | Borrower | Loan Amount |
|---|---|---|---|
| Previous Owner | Govindarajulu Mahender Nanduri | $399,200 | |
| Previous Owner | Ajao Oyeniran | $284,014 |
Source: Public Records
Tax History
| Year | Tax Paid | Tax Assessment Tax Assessment Total Assessment is a certain percentage of the fair market value that is determined by local assessors to be the total taxable value of land and additions on the property. | Land | Improvement |
|---|---|---|---|---|
| 2025 | $5,777 | $42,660 | $10,780 | $31,880 |
| 2024 | $5,777 | $51,130 | $9,750 | $41,380 |
| 2023 | $5,821 | $51,130 | $9,750 | $41,380 |
| 2022 | $4,659 | $35,280 | $6,650 | $28,630 |
| 2021 | $4,820 | $35,280 | $6,650 | $28,630 |
| 2020 | $4,475 | $33,610 | $7,810 | $25,800 |
| 2019 | $4,519 | $33,610 | $7,810 | $25,800 |
| 2018 | $4,215 | $30,140 | $6,970 | $23,170 |
| 2017 | $4,337 | $30,140 | $6,970 | $23,170 |
| 2016 | $3,895 | $20,550 | $6,770 | $13,780 |
| 2015 | $2,902 | $20,550 | $6,770 | $13,780 |
| 2014 | $720 | $4,680 | $4,680 | $0 |
Source: Public Records
Map
Nearby Homes
- 10877 Touchstone Loop
- 10890 Touchstone Loop
- 14027 Touchstone St
- 14048 Pastel Ln
- 10776 Hillsboro Cir
- 14402 Big Stone Dr
- 10750 Hillrose St
- 14480 Double Dutch Cir
- 11127 Pastel Point
- 14368 Double Dutch Cir
- 14317 Double Dutch Loop
- 14101 Yellow Tip Dr
- 14763 Pepper Pike Place
- 10532 Lexington Ln
- 14760 Domino Dr
- 10867 Mcharg Ct
- 14088 Night Owl Ln
- 10429 Sierra Ridge Dr
- 14822 Vienna Cir
- 10473 Rutledge St
- 10859 Touchstone Loop
- 10867 Touchstone Loop
- 10855 Touchstone Loop
- 10869 Touchstone Loop
- 10943 Touchstone Loop
- 10947 Touchstone Loop
- 10862 Touchstone Loop
- 10851 Touchstone Loop
- 10873 Touchstone Loop
- 10866 Touchstone Loop
- 10955 Touchstone Loop
- 10858 Touchstone Loop
- 10939 Touchstone Loop
- 10854 Touchstone Loop
- 10870 Touchstone Loop
- 10935 Touchstone Loop
- 10959 Touchstone Loop
- 10850 Touchstone Loop
- 10874 Touchstone Loop
- 10931 Touchstone Loop
Your Personal Tour Guide
Ask me questions while you tour the home.