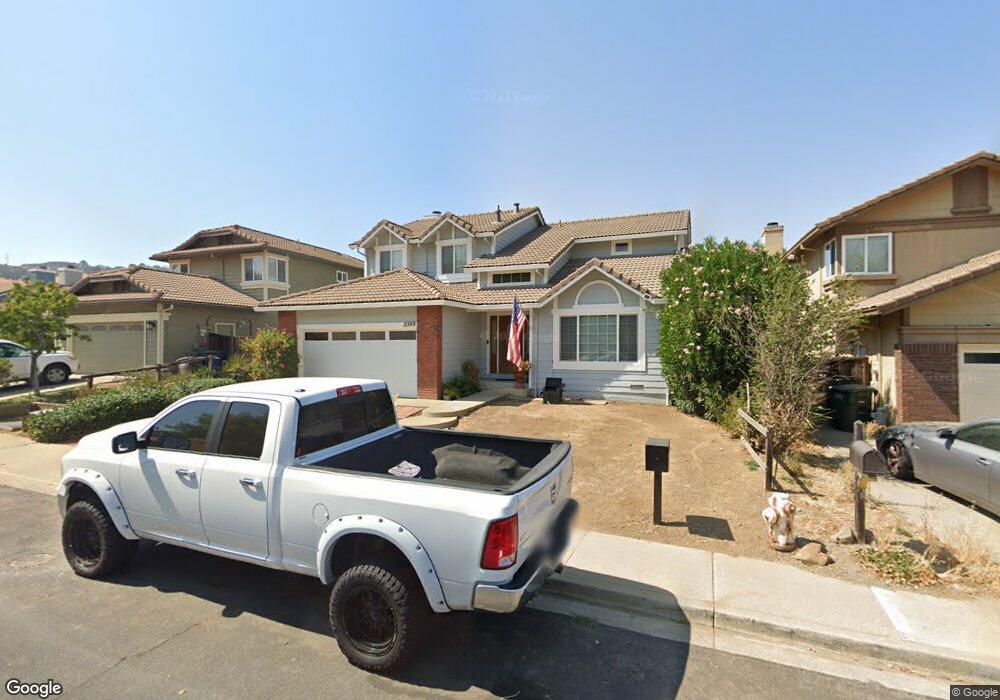
1089 Discovery Way Concord, CA 94521
The Highlands NeighborhoodEstimated Value: $1,040,000 - $1,188,000
4
Beds
3
Baths
2,135
Sq Ft
$519/Sq Ft
Est. Value
About This Home
This home is located at 1089 Discovery Way, Concord, CA 94521 and is currently estimated at $1,107,717, approximately $518 per square foot. 1089 Discovery Way is a home located in Contra Costa County with nearby schools including Highlands Elementary School, Mt. Diablo Elementary School, and Pine Hollow Middle School.
Ownership History
Date
Name
Owned For
Owner Type
Purchase Details
Closed on
Oct 27, 2022
Sold by
Armstrong Marion R
Bought by
Marion Armstrong Trust and Armstrong
Current Estimated Value
Create a Home Valuation Report for This Property
The Home Valuation Report is an in-depth analysis detailing your home's value as well as a comparison with similar homes in the area
Home Values in the Area
Average Home Value in this Area
Purchase History
| Date | Buyer | Sale Price | Title Company |
|---|---|---|---|
| Marion Armstrong Trust | -- | None Listed On Document |
Source: Public Records
Tax History Compared to Growth
Tax History
| Year | Tax Paid | Tax Assessment Tax Assessment Total Assessment is a certain percentage of the fair market value that is determined by local assessors to be the total taxable value of land and additions on the property. | Land | Improvement |
|---|---|---|---|---|
| 2025 | $5,519 | $412,697 | $149,285 | $263,412 |
| 2024 | $5,407 | $404,606 | $146,358 | $258,248 |
| 2023 | $5,407 | $396,674 | $143,489 | $253,185 |
| 2022 | $5,325 | $388,897 | $140,676 | $248,221 |
| 2021 | $5,189 | $381,272 | $137,918 | $243,354 |
| 2019 | $5,085 | $369,965 | $133,828 | $236,137 |
| 2018 | $4,893 | $362,711 | $131,204 | $231,507 |
| 2017 | $4,728 | $355,600 | $128,632 | $226,968 |
| 2016 | $4,590 | $348,628 | $126,110 | $222,518 |
| 2015 | $4,526 | $343,392 | $124,216 | $219,176 |
| 2014 | $4,438 | $336,666 | $121,783 | $214,883 |
Source: Public Records
Map
Nearby Homes
- 1169 Discovery Way
- 5295 Crystyl Ranch Dr
- 5391 Fernbank Dr
- 960 Maplegate Ct
- 5497 Silver Sage Ct
- 5146 Red Oak Dr
- 1302 New Hampshire Dr
- 1152 Via Doble
- 5258 Pebble Glen Dr
- 1201 Illinois Ct
- 1056 Deer Oak Place
- 1181 Blue Lake Way
- 5470 Roundtree Dr Unit F
- 1015 Hidden Oak Ct
- 5508 Connecticut Dr
- 4695 S Larwin Ave
- 1395 Kenwal Rd Unit A
- 5540 Michigan Blvd
- 4490 Sheepberry Ct
- 5555 Alabama Dr
- 1091 Discovery Way
- 1087 Discovery Way
- 1085 Discovery Way
- 1093 Discovery Way
- 1088 Discovery Way
- 1083 Discovery Way
- 1095 Discovery Way
- 1090 Discovery Way
- 1092 Discovery Way
- 1097 Discovery Way
- 1081 Discovery Way
- 1094 Discovery Way
- 1079 Discovery Way
- 1099 Discovery Way
- 1077 Discovery Way
- 1101 Discovery Way
- 1075 Discovery Way
- 1103 Discovery Way
- 1074 Discovery Way
- 1073 Discovery Way