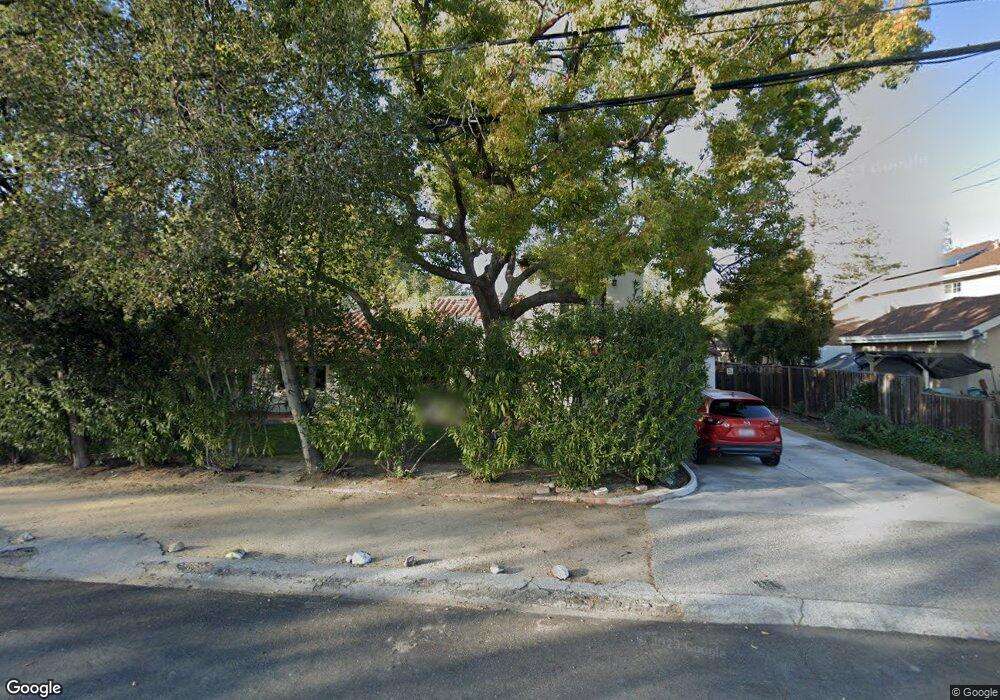
1089 W Parr Ave Campbell, CA 95008
San Tomas NeighborhoodEstimated Value: $2,591,000 - $3,045,000
4
Beds
3
Baths
1,068
Sq Ft
$2,625/Sq Ft
Est. Value
About This Home
This home is located at 1089 W Parr Ave, Campbell, CA 95008 and is currently estimated at $2,803,720, approximately $2,625 per square foot. 1089 W Parr Ave is a home located in Santa Clara County with nearby schools including Westmont High School, Village School, and Capri Elementary.
Ownership History
Date
Name
Owned For
Owner Type
Purchase Details
Closed on
Jun 24, 2021
Sold by
Madden Stephen P and Zapiola Ines
Bought by
Madden Stephen Paul and Zapiola Ines
Current Estimated Value
Home Financials for this Owner
Home Financials are based on the most recent Mortgage that was taken out on this home.
Original Mortgage
$700,000
Outstanding Balance
$633,763
Interest Rate
2.9%
Mortgage Type
New Conventional
Estimated Equity
$2,169,957
Purchase Details
Closed on
Sep 13, 2019
Sold by
Ines Madden Stephen P and Ines Zaplola
Bought by
Madden Stephen P and Zapiola Ines
Purchase Details
Closed on
Dec 10, 1998
Sold by
Harvey Holden
Bought by
Madden Stephen P and Zapiola Ines
Home Financials for this Owner
Home Financials are based on the most recent Mortgage that was taken out on this home.
Original Mortgage
$348,000
Interest Rate
6.86%
Create a Home Valuation Report for This Property
The Home Valuation Report is an in-depth analysis detailing your home's value as well as a comparison with similar homes in the area
Home Values in the Area
Average Home Value in this Area
Purchase History
| Date | Buyer | Sale Price | Title Company |
|---|---|---|---|
| Madden Stephen Paul | -- | Old Republic Title Company | |
| Madden Stephen P | -- | None Available | |
| Madden Stephen P | $435,000 | Alliance Title Company |
Source: Public Records
Mortgage History
| Date | Status | Borrower | Loan Amount |
|---|---|---|---|
| Open | Madden Stephen Paul | $700,000 | |
| Closed | Madden Stephen P | $348,000 |
Source: Public Records
Tax History
| Year | Tax Paid | Tax Assessment Tax Assessment Total Assessment is a certain percentage of the fair market value that is determined by local assessors to be the total taxable value of land and additions on the property. | Land | Improvement |
|---|---|---|---|---|
| 2025 | $9,800 | $748,896 | $442,085 | $306,811 |
| 2024 | $9,800 | $734,213 | $433,417 | $300,796 |
| 2023 | $9,667 | $719,818 | $424,919 | $294,899 |
| 2022 | $9,626 | $705,705 | $416,588 | $289,117 |
| 2021 | $9,444 | $691,869 | $408,420 | $283,449 |
| 2020 | $9,196 | $684,776 | $404,233 | $280,543 |
| 2019 | $9,059 | $671,350 | $396,307 | $275,043 |
| 2018 | $8,776 | $658,187 | $388,537 | $269,650 |
| 2017 | $8,644 | $645,282 | $380,919 | $264,363 |
| 2016 | $8,128 | $632,630 | $373,450 | $259,180 |
| 2015 | $7,983 | $623,128 | $367,841 | $255,287 |
| 2014 | $7,683 | $610,923 | $360,636 | $250,287 |
Source: Public Records
Map
Nearby Homes
- 380 School Ct
- 320 Pine Wood Ln
- 576 W Parr Ave Unit 9
- 576 W Parr Ave Unit 3
- 576 W Parr Ave Unit 1
- 810 Virginia Ct
- 14355 La Rinconada Dr
- 207 Palmer Dr
- 1285 Capri Dr
- 14225 Lora Dr Unit 17
- 14225 Lora Dr Unit 51
- 1430 Westmont Ave
- 963 Connie Dr
- 803 W Sunnyoaks Ave
- 1177 Smith Ave
- 832 Mary Ct
- 14685 Oka Rd Unit 11
- 872 Loyalton Dr
- 734 Pecan Way
- 786 Sharmon Palms Ln
- 1079 W Parr Ave
- 1099 W Parr Ave
- 1067 W Parr Ave
- 1113 W Parr Ave
- 1082 Lucot Way
- 1510 Oburn Ct
- 1092 Lucot Way
- 1508 Oburn Ct
- 1057 W Parr Ave
- 1074 Lucot Way
- 1127 W Parr Ave
- 1509 Oburn Ct
- 1506 Oburn Ct
- 1062 Lucot Way
- 1047 W Parr Ave Unit A
- 1047 W Parr Ave
- 1507 Oburn Ct
- 1566 Hack Ave
- 1584 Hack Ave
- 1091 Lucot Way
Your Personal Tour Guide
Ask me questions while you tour the home.