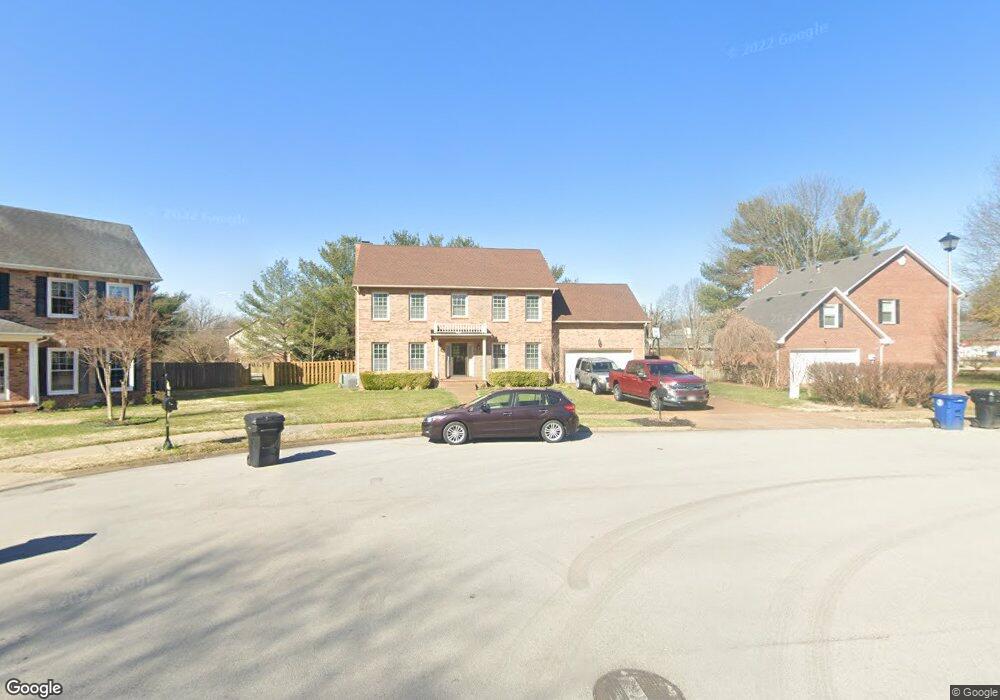
109 McGavock Cir Franklin, TN 37064
Central Franklin NeighborhoodEstimated Value: $753,902 - $1,030,000
--
Bed
3
Baths
3,000
Sq Ft
$281/Sq Ft
Est. Value
About This Home
This home is located at 109 McGavock Cir, Franklin, TN 37064 and is currently estimated at $841,726, approximately $280 per square foot. 109 McGavock Cir is a home located in Williamson County with nearby schools including Liberty Elementary School, Freedom Intermediate School, and Freedom Middle School.
Ownership History
Date
Name
Owned For
Owner Type
Purchase Details
Closed on
Oct 6, 2021
Sold by
Brackebusch Barry C and Brackebusch Melissa K
Bought by
Brackebusch Barry C and Brackebusch Melissa Kaye
Current Estimated Value
Purchase Details
Closed on
Sep 3, 2010
Sold by
Rogers Richard S and Rogers Lynn
Bought by
Brackebusch Barry C and Brackebusch Melissa K
Home Financials for this Owner
Home Financials are based on the most recent Mortgage that was taken out on this home.
Original Mortgage
$260,900
Outstanding Balance
$172,915
Interest Rate
4.59%
Mortgage Type
New Conventional
Estimated Equity
$668,811
Purchase Details
Closed on
Jul 30, 2004
Sold by
Holt Betty
Bought by
Rogers Richard S
Home Financials for this Owner
Home Financials are based on the most recent Mortgage that was taken out on this home.
Original Mortgage
$206,550
Interest Rate
5.63%
Mortgage Type
Purchase Money Mortgage
Purchase Details
Closed on
Oct 29, 2001
Sold by
Bonds W H and Bonds Patricia C
Bought by
Holt Samuel and Holt Betty
Create a Home Valuation Report for This Property
The Home Valuation Report is an in-depth analysis detailing your home's value as well as a comparison with similar homes in the area
Home Values in the Area
Average Home Value in this Area
Purchase History
| Date | Buyer | Sale Price | Title Company |
|---|---|---|---|
| Brackebusch Barry C | -- | None Available | |
| Brackebusch Barry C | $289,900 | Realty Title & Escrow Co Inc | |
| Rogers Richard S | $229,500 | Advantage Title & Escrow | |
| Holt Samuel | $182,000 | -- |
Source: Public Records
Mortgage History
| Date | Status | Borrower | Loan Amount |
|---|---|---|---|
| Open | Brackebusch Barry C | $260,900 | |
| Previous Owner | Rogers Richard S | $206,550 |
Source: Public Records
Tax History Compared to Growth
Tax History
| Year | Tax Paid | Tax Assessment Tax Assessment Total Assessment is a certain percentage of the fair market value that is determined by local assessors to be the total taxable value of land and additions on the property. | Land | Improvement |
|---|---|---|---|---|
| 2025 | $3,587 | $207,150 | $60,000 | $147,150 |
| 2024 | $3,587 | $126,675 | $30,000 | $96,675 |
| 2023 | $3,447 | $126,675 | $30,000 | $96,675 |
| 2022 | $3,447 | $126,675 | $30,000 | $96,675 |
| 2021 | $3,447 | $126,675 | $30,000 | $96,675 |
| 2020 | $3,175 | $98,400 | $21,250 | $77,150 |
| 2019 | $3,175 | $98,400 | $21,250 | $77,150 |
| 2018 | $3,106 | $98,400 | $21,250 | $77,150 |
| 2017 | $3,057 | $98,400 | $21,250 | $77,150 |
| 2016 | $0 | $98,400 | $21,250 | $77,150 |
| 2015 | -- | $78,425 | $18,750 | $59,675 |
| 2014 | -- | $78,425 | $18,750 | $59,675 |
Source: Public Records
Map
Nearby Homes
- 1 Pinewood Rd
- 801 Murfreesboro Rd
- 433 Dragonfly Ct
- 100 Basil Ct
- 1143 Buckingham Cir
- 1183 Buckingham Cir
- 521 Maplegrove Dr
- 1011 Murfreesboro Rd Unit B2
- 224 Hickory Dr
- 217 Maple Dr
- 624 Burghley Ln
- 320 Liberty Pike Unit 212
- 224 3rd Ave S
- 2741 Kennedy Ct Unit 2741
- 697 Watson Branch Dr
- 0102 Tbd
- 0104 Tbd
- 0101 Tbd
- 2433 Kennedy Ct Unit 2433
- 229 Cambridge Place
- 1105 Glenbrook Dr
- 113 McGavock Cir
- 115 McGavock Cir
- 1111 Glenbrook Dr
- 115 Pebble View Dr
- 112 McGavock Cir
- 106 Pebble View Dr
- 108 McGavock Cir
- 117 Pebble View Dr
- 1104 Glenbrook Dr
- 1115 Glenbrook Dr
- 1108 Glenbrook Dr
- 1112 Glenbrook Dr
- 110 Pebble View Dr
- 119 Pebble View Dr
- 114 Pebble View Dr
- 1119 Glenbrook Dr
- 1116 Glenbrook Dr
- 118 Pebble View Dr
- 313 Scottish Ct