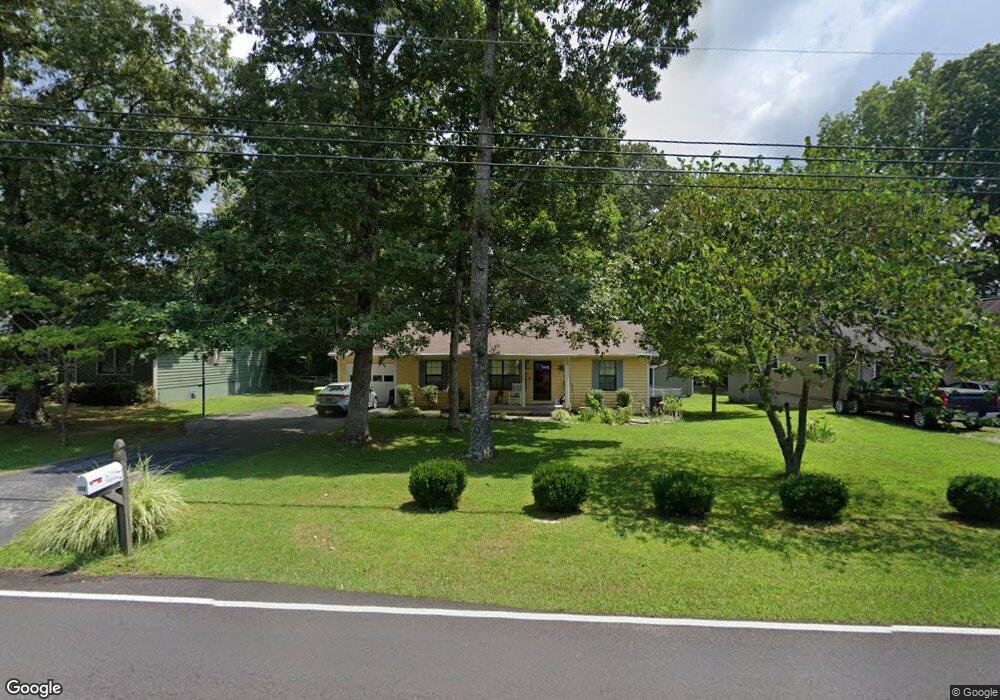
109 Spruce Loop Crossville, TN 38555
Estimated Value: $207,000 - $276,000
--
Bed
2
Baths
1,304
Sq Ft
$182/Sq Ft
Est. Value
About This Home
This home is located at 109 Spruce Loop, Crossville, TN 38555 and is currently estimated at $237,092, approximately $181 per square foot. 109 Spruce Loop is a home located in Cumberland County with nearby schools including Glenn Martin Elementary School, Cumberland County High School, and Christian Academy of the Cumberlands.
Ownership History
Date
Name
Owned For
Owner Type
Purchase Details
Closed on
Dec 16, 2008
Sold by
Mckeel Jon
Bought by
Stephens Laura M
Current Estimated Value
Home Financials for this Owner
Home Financials are based on the most recent Mortgage that was taken out on this home.
Original Mortgage
$68,000
Outstanding Balance
$20,966
Interest Rate
5.96%
Estimated Equity
$216,126
Purchase Details
Closed on
May 17, 2005
Sold by
Vitti Sherry Leigh Aka
Bought by
Mckeel Jon
Purchase Details
Closed on
May 21, 2002
Sold by
Sooter Barry Joe
Bought by
Axley Sherry Leigh
Home Financials for this Owner
Home Financials are based on the most recent Mortgage that was taken out on this home.
Original Mortgage
$79,200
Interest Rate
6.92%
Purchase Details
Closed on
Mar 9, 2000
Bought by
Sooter Barry Joe % Union Planters Bank Na
Purchase Details
Closed on
Apr 9, 1990
Bought by
Wyatt Lisa Renee
Create a Home Valuation Report for This Property
The Home Valuation Report is an in-depth analysis detailing your home's value as well as a comparison with similar homes in the area
Home Values in the Area
Average Home Value in this Area
Purchase History
| Date | Buyer | Sale Price | Title Company |
|---|---|---|---|
| Stephens Laura M | $95,000 | -- | |
| Mckeel Jon | $90,500 | -- | |
| Axley Sherry Leigh | -- | -- | |
| Sooter Barry Joe % Union Planters Bank Na | $80,900 | -- | |
| Wyatt Lisa Renee | $53,000 | -- |
Source: Public Records
Mortgage History
| Date | Status | Borrower | Loan Amount |
|---|---|---|---|
| Open | Wyatt Lisa Renee | $68,000 | |
| Previous Owner | Wyatt Lisa Renee | $79,200 |
Source: Public Records
Tax History Compared to Growth
Tax History
| Year | Tax Paid | Tax Assessment Tax Assessment Total Assessment is a certain percentage of the fair market value that is determined by local assessors to be the total taxable value of land and additions on the property. | Land | Improvement |
|---|---|---|---|---|
| 2024 | $427 | $37,600 | $5,000 | $32,600 |
| 2023 | $427 | $37,600 | $0 | $0 |
| 2022 | $427 | $37,600 | $5,000 | $32,600 |
| 2021 | $328 | $20,925 | $3,750 | $17,175 |
| 2020 | $331 | $20,925 | $3,750 | $17,175 |
| 2019 | $331 | $21,150 | $3,750 | $17,400 |
| 2018 | $331 | $21,150 | $3,750 | $17,400 |
| 2017 | $331 | $21,150 | $3,750 | $17,400 |
| 2016 | $322 | $21,075 | $3,750 | $17,325 |
| 2015 | $316 | $21,075 | $3,750 | $17,325 |
| 2014 | $316 | $21,070 | $0 | $0 |
Source: Public Records
Map
Nearby Homes
- 1015 Myrtle Ave
- 172 Sandpiper Loop
- 198 Orange Cir
- 101 Sandpiper Loop
- 573 Mockingbird Dr
- 330 Carriage Dr
- 109 Canary Ct
- 33 Crescent Point
- 669 Myrtle Ave
- 41 Peachtree Dr
- 0 Satsuma Dr Unit RTC2774380
- 0 Satsuma Dr Unit RTC2774370
- 30 Cardinal Loop
- 0 0 72 Ac Holiday Dr
- 1042 Holiday Dr
- 0.72 ac Holiday Dr
- 71 Marymont Dr
- Lot 1736 Satsuma Dr
- Lot 1735 Satsuma Dr
- 125 Spruce Loop
- 95 Spruce Loop
- 77 Spruce Loop
- 406 Rhodendron Cir
- 400 Rhodendron Cir
- 98 Spruce Loop
- 159 Spruce Loop
- 130 Spruce Loop
- 61 Spruce Loop
- 88 Spruce Loop
- 432 Rhodendron Cir
- 432 Rhododendron Cir
- 384 Rhodendron Cir
- 175 Spruce Loop
- 152 Spruce Loop
- 454 Rhodendron Cir
- 415 Rhodendron Cir
- 911 Mockingbird Dr
- 124 Calloway Dr
- 189 Spruce Loop