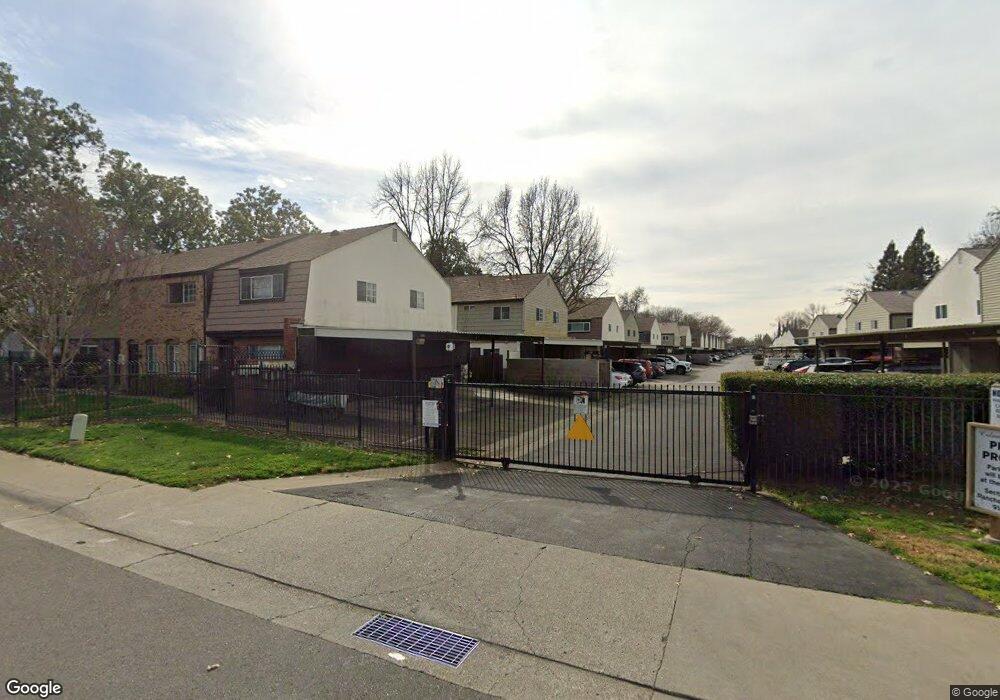
10901 Coloma Rd Unit 1 Rancho Cordova, CA 95670
Mills Ranch NeighborhoodEstimated Value: $192,000 - $226,000
2
Beds
2
Baths
896
Sq Ft
$229/Sq Ft
Est. Value
About This Home
This home is located at 10901 Coloma Rd Unit 1, Rancho Cordova, CA 95670 and is currently estimated at $205,396, approximately $229 per square foot. 10901 Coloma Rd Unit 1 is a home located in Sacramento County with nearby schools including Riverview STEM Elementary School, Peter J. Shields Elementary School, and W.E. Mitchell Middle School.
Ownership History
Date
Name
Owned For
Owner Type
Purchase Details
Closed on
Apr 30, 1999
Sold by
U S Bank National Assn
Bought by
Va
Current Estimated Value
Purchase Details
Closed on
Aug 31, 1998
Sold by
Gray Bridget S
Bought by
U S Bank National Assn and United States National Bank Of Oregon
Purchase Details
Closed on
Jul 25, 1995
Sold by
Taitano Vincent T and Taitano Maria T
Bought by
Gray Bridget S
Home Financials for this Owner
Home Financials are based on the most recent Mortgage that was taken out on this home.
Original Mortgage
$50,512
Interest Rate
7.83%
Create a Home Valuation Report for This Property
The Home Valuation Report is an in-depth analysis detailing your home's value as well as a comparison with similar homes in the area
Home Values in the Area
Average Home Value in this Area
Purchase History
| Date | Buyer | Sale Price | Title Company |
|---|---|---|---|
| Va | $46,500 | Stewart Title | |
| U S Bank National Assn | $53,979 | Chicago Title Co | |
| Gray Bridget S | $52,000 | Old Republic Title Company |
Source: Public Records
Mortgage History
| Date | Status | Borrower | Loan Amount |
|---|---|---|---|
| Previous Owner | Gray Bridget S | $50,512 |
Source: Public Records
Tax History Compared to Growth
Tax History
| Year | Tax Paid | Tax Assessment Tax Assessment Total Assessment is a certain percentage of the fair market value that is determined by local assessors to be the total taxable value of land and additions on the property. | Land | Improvement |
|---|---|---|---|---|
| 2025 | $72 | $72,870 | $34,476 | $38,394 |
| 2024 | $72 | $71,442 | $33,800 | $37,642 |
| 2023 | $70 | $70,042 | $33,138 | $36,904 |
| 2022 | $67 | $68,670 | $32,489 | $36,181 |
| 2021 | $66 | $67,324 | $31,852 | $35,472 |
| 2020 | $64 | $66,635 | $31,526 | $35,109 |
| 2019 | $63 | $65,329 | $30,908 | $34,421 |
| 2018 | $61 | $64,049 | $30,302 | $33,747 |
| 2017 | $59 | $62,794 | $29,708 | $33,086 |
| 2016 | $29 | $61,564 | $29,126 | $32,438 |
| 2015 | $29 | $60,640 | $28,689 | $31,951 |
| 2014 | $29 | $59,454 | $28,128 | $31,326 |
Source: Public Records
Map
Nearby Homes
- 1920 Benita Dr
- 2200 Kimwood Ln
- 10872 Oakton Way
- 1977 Benita Dr Unit 1
- 2255 El Manto Dr
- 10835 Coloma Rd Unit 3
- 2256 Ramo Ct
- 2337 Benita Dr
- 2352 Sonata Dr
- 2329 Mcgregor Dr
- 2404 Coolidge Way
- 11100 Trinity River Dr
- 11150 Trinity River Dr Unit 41
- 11150 Trinity River Dr
- 11150 Trinity River Dr Unit 59
- 10825 Walnutwood Way
- 259 Rocky Hills Ln
- 27 Golden Inn Way
- 311 Sunny Hills Dr
- 328 Sierra Vista Dr
- 10901 Coloma Rd
- 10901 Coloma Rd Unit 3
- 10901 Coloma Rd Unit 2
- 10897 Coloma Rd
- 10897 Coloma Rd
- 10897 Coloma Rd Unit 3
- 10897 Coloma Rd Unit 4
- 10905 Coloma Rd Unit 1
- 10905 Coloma Rd Unit 3
- 10905 Coloma Rd Unit 2
- 10905 Coloma Rd Unit 4
- 10893 Coloma Rd Unit 4
- 10893 Coloma Rd
- 10893 Coloma Rd
- 10893 Coloma Rd Unit 3
- 10893 Coloma Rd Unit 2
- 1933 Benita Dr
- 1933 Benita Dr
- 1933 Benita Dr
- 1933 Benita Dr Unit 4