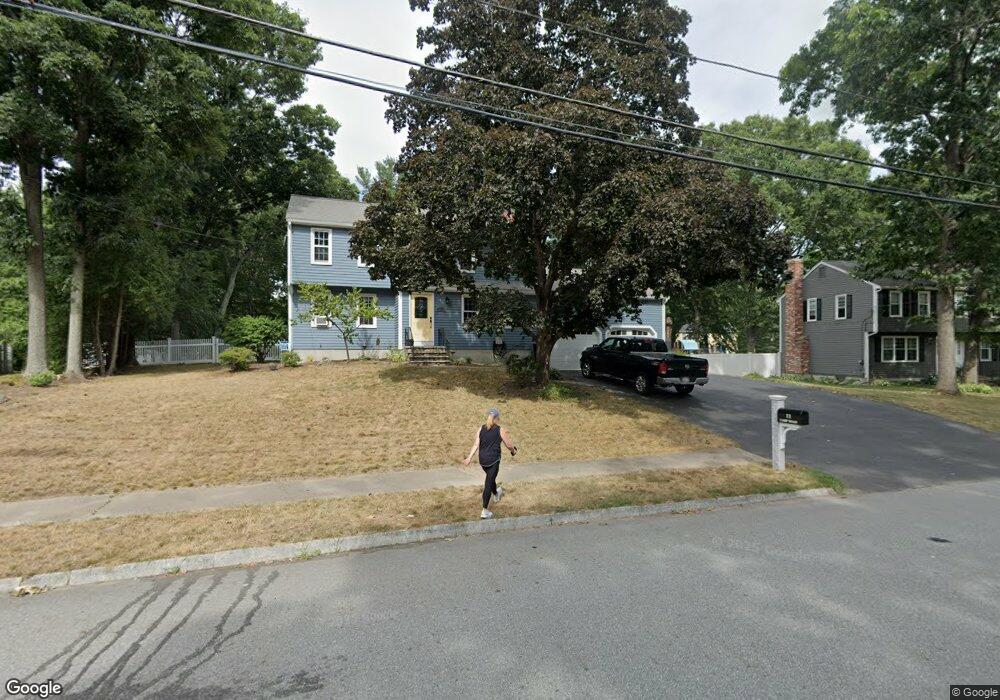
11 Carp Rd Milford, MA 01757
Estimated Value: $651,000 - $745,000
5
Beds
3
Baths
2,500
Sq Ft
$274/Sq Ft
Est. Value
About This Home
This home is located at 11 Carp Rd, Milford, MA 01757 and is currently estimated at $685,109, approximately $274 per square foot. 11 Carp Rd is a home located in Worcester County with nearby schools including Milford High School.
Ownership History
Date
Name
Owned For
Owner Type
Purchase Details
Closed on
Apr 16, 2021
Sold by
Silverstri Craig and Silverstri Mary A
Bought by
Silverstri Ft
Current Estimated Value
Purchase Details
Closed on
Apr 5, 2002
Sold by
Weaver David S and Weaver Jennifer T
Bought by
Silvestri Craig and Silvestri Mary Ann
Home Financials for this Owner
Home Financials are based on the most recent Mortgage that was taken out on this home.
Original Mortgage
$283,500
Interest Rate
6.85%
Mortgage Type
Purchase Money Mortgage
Purchase Details
Closed on
May 21, 1997
Sold by
Gillis Susan Diane
Bought by
Weaver David S and Weaver Jennifer T
Purchase Details
Closed on
Sep 9, 1988
Sold by
Odea John S
Bought by
Gillis Susan D
Create a Home Valuation Report for This Property
The Home Valuation Report is an in-depth analysis detailing your home's value as well as a comparison with similar homes in the area
Home Values in the Area
Average Home Value in this Area
Purchase History
| Date | Buyer | Sale Price | Title Company |
|---|---|---|---|
| Silverstri Ft | -- | None Available | |
| Silvestri Craig | $315,500 | -- | |
| Weaver David S | $189,000 | -- | |
| Gillis Susan D | $189,000 | -- |
Source: Public Records
Mortgage History
| Date | Status | Borrower | Loan Amount |
|---|---|---|---|
| Previous Owner | Gillis Susan D | $283,500 | |
| Previous Owner | Gillis Susan D | $283,500 | |
| Previous Owner | Gillis Susan D | $150,000 |
Source: Public Records
Tax History Compared to Growth
Tax History
| Year | Tax Paid | Tax Assessment Tax Assessment Total Assessment is a certain percentage of the fair market value that is determined by local assessors to be the total taxable value of land and additions on the property. | Land | Improvement |
|---|---|---|---|---|
| 2025 | $7,898 | $617,000 | $188,800 | $428,200 |
| 2024 | $7,819 | $588,300 | $181,200 | $407,100 |
| 2023 | $7,342 | $508,100 | $156,700 | $351,400 |
| 2022 | $6,938 | $450,800 | $143,500 | $307,300 |
| 2021 | $6,616 | $414,000 | $143,500 | $270,500 |
| 2020 | $6,536 | $409,500 | $143,500 | $266,000 |
| 2019 | $6,366 | $384,900 | $143,500 | $241,400 |
| 2018 | $6,311 | $381,100 | $139,700 | $241,400 |
| 2017 | $6,088 | $362,600 | $139,700 | $222,900 |
| 2016 | $5,991 | $348,700 | $139,700 | $209,000 |
| 2015 | $5,867 | $334,300 | $132,200 | $202,100 |
Source: Public Records
Map
Nearby Homes
- 26 Zain Cir
- 4 Turin St
- 12 Alder St
- 53 Medway Rd
- 16 Lombardi Cir
- 56 Fisher St
- 4 E Charles St
- 11 Lena Ln Unit 2
- 35 Woodland Ave Unit 35A
- 9 Tulip Way
- 375 Central St
- 15 Free St
- Lot 1 Florence St
- 9 Black Bear Cir Unit 9
- 41 Black Bear Cir Unit 41
- 7 Black Bear Unit 7
- 5 Black Bear Cir Unit 5
- 45 Black Bear Cir Unit 45
- 48 Black Bear Cir Unit 48
- 3 Black Bear Cir Unit 3