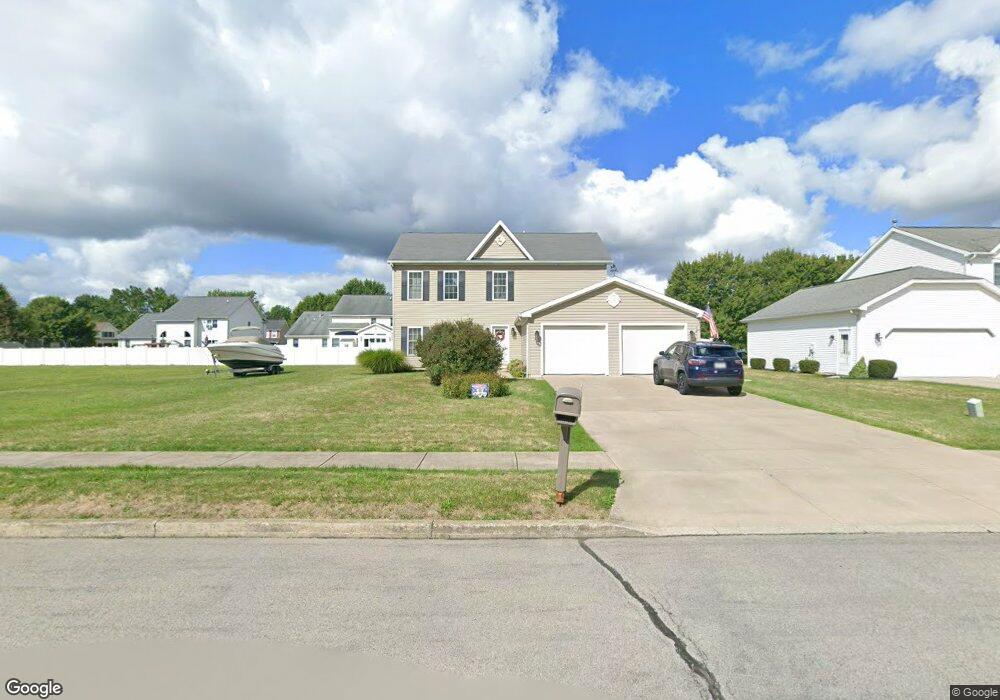
11 Desales Cir Lockport, NY 14094
Estimated Value: $338,000 - $433,268
3
Beds
3
Baths
2,186
Sq Ft
$175/Sq Ft
Est. Value
About This Home
This home is located at 11 Desales Cir, Lockport, NY 14094 and is currently estimated at $382,317, approximately $174 per square foot. 11 Desales Cir is a home located in Niagara County with nearby schools including Aaron Mossell Junior High School, Lockport High School, and DeSales Catholic School.
Ownership History
Date
Name
Owned For
Owner Type
Purchase Details
Closed on
May 26, 2021
Sold by
Criddle Amanda M and Gueli Amanda M
Bought by
Criddle James A and Criddle Amanda M
Current Estimated Value
Purchase Details
Closed on
Jul 21, 2020
Sold by
Gouch Jason
Bought by
Criddle James A and Criddle Amanda M
Purchase Details
Closed on
Apr 14, 2011
Sold by
Gueli Raymond G and Gueli Amanda M
Bought by
Gueli Amanda M
Purchase Details
Closed on
Apr 8, 2009
Sold by
Bcg Group Inc
Bought by
Gueli Raymond G and Gueli Amanda M
Home Financials for this Owner
Home Financials are based on the most recent Mortgage that was taken out on this home.
Original Mortgage
$162,501
Interest Rate
4.94%
Mortgage Type
FHA
Purchase Details
Closed on
Jun 1, 2007
Sold by
Bonner Mark
Bought by
Bcg Group Inc
Create a Home Valuation Report for This Property
The Home Valuation Report is an in-depth analysis detailing your home's value as well as a comparison with similar homes in the area
Home Values in the Area
Average Home Value in this Area
Purchase History
| Date | Buyer | Sale Price | Title Company |
|---|---|---|---|
| Criddle James A | -- | None Available | |
| Criddle James A | $2,500 | None Available | |
| Gueli Amanda M | -- | None Available | |
| Gueli Raymond G | $165,500 | None Available | |
| Bcg Group Inc | $37,150 | Allen Miskell |
Source: Public Records
Mortgage History
| Date | Status | Borrower | Loan Amount |
|---|---|---|---|
| Previous Owner | Gueli Raymond G | $162,501 |
Source: Public Records
Tax History Compared to Growth
Tax History
| Year | Tax Paid | Tax Assessment Tax Assessment Total Assessment is a certain percentage of the fair market value that is determined by local assessors to be the total taxable value of land and additions on the property. | Land | Improvement |
|---|---|---|---|---|
| 2024 | $8,841 | $341,000 | $25,200 | $315,800 |
| 2023 | $8,841 | $334,000 | $25,200 | $308,800 |
| 2022 | $6,687 | $306,000 | $25,200 | $280,800 |
| 2021 | $6,338 | $176,600 | $19,400 | $157,200 |
| 2020 | $6,116 | $176,600 | $19,400 | $157,200 |
| 2019 | $1,527 | $176,600 | $19,400 | $157,200 |
| 2018 | $4,210 | $176,600 | $19,400 | $157,200 |
| 2017 | $4,171 | $176,600 | $19,400 | $157,200 |
| 2016 | $3,951 | $175,200 | $19,400 | $155,800 |
| 2015 | -- | $175,200 | $19,400 | $155,800 |
| 2014 | -- | $175,200 | $19,400 | $155,800 |
Source: Public Records
Map
Nearby Homes