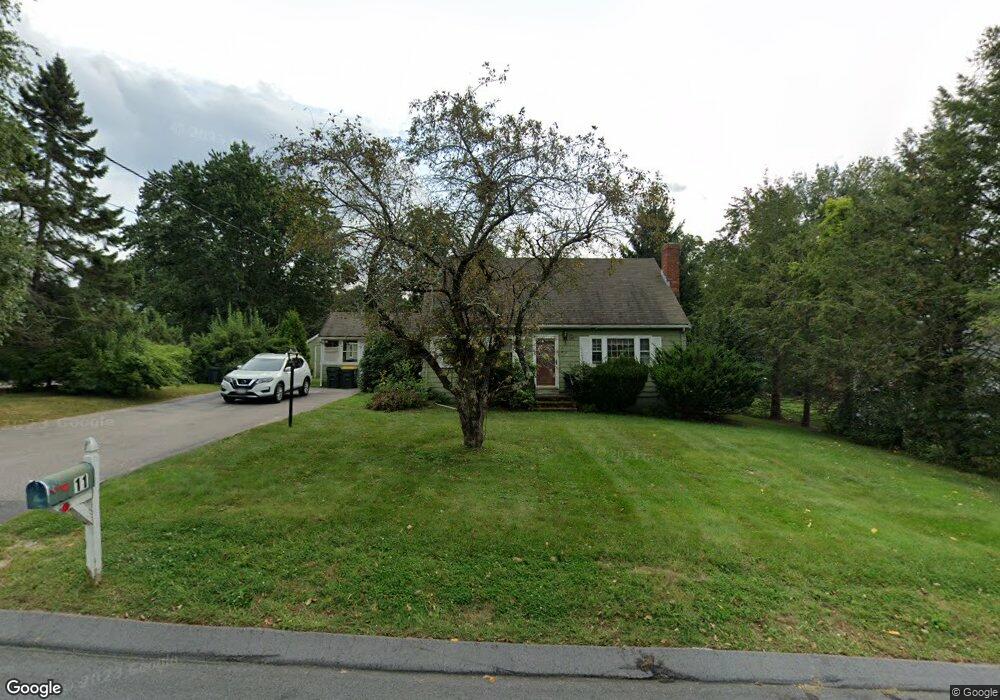
11 Glenn Dr Franklin, MA 02038
Estimated Value: $633,236 - $678,000
About This Home
This home is located at 11 Glenn Dr, Franklin, MA 02038 and is currently estimated at $653,559, approximately $457 per square foot. 11 Glenn Dr is a home located in Norfolk County with nearby schools including Helen Keller Elementary School, Annie Sullivan Middle School, and Franklin High School.
Ownership History
We collect this data history from publicly available records. To have your information removed, we recommend requesting removal directly through your county’s website.
Purchase Details
Purchase Details
Home Financials for this Owner
Home Financials are based on the most recent Mortgage that was taken out on this home.Purchase History
We collect this data history from publicly available records. To have your information removed, we recommend requesting removal directly through your county’s website.
| Date | Buyer | Sale Price | Title Company |
|---|---|---|---|
| -- | -- | ||
| $160,000 | -- |
Mortgage History
We collect this data history from publicly available records. To have your information removed, we recommend requesting removal directly through your county’s website.
| Date | Status | Borrower | Loan Amount |
|---|---|---|---|
| Previous Owner | $129,000 | ||
| Previous Owner | $128,000 |
Tax History
We collect this data history from publicly available records. To have your information removed, we recommend requesting removal directly through your county’s website.
| Year | Tax Paid | Tax Assessment Tax Assessment Total Assessment is a certain percentage of the fair market value that is determined by local assessors to be the total taxable value of land and additions on the property. | Land | Improvement |
|---|---|---|---|---|
| 2025 | $6,611 | $568,900 | $326,400 | $242,500 |
| 2024 | $6,602 | $560,000 | $326,400 | $233,600 |
| 2023 | $6,299 | $500,700 | $278,200 | $222,500 |
| 2022 | $5,834 | $415,200 | $219,100 | $196,100 |
| 2021 | $5,904 | $403,000 | $246,000 | $157,000 |
| 2020 | $5,589 | $385,200 | $235,900 | $149,300 |
| 2019 | $5,499 | $375,100 | $225,800 | $149,300 |
| 2018 | $5,149 | $351,500 | $217,700 | $133,800 |
| 2017 | $4,890 | $335,400 | $201,600 | $133,800 |
| 2016 | $4,844 | $334,100 | $216,500 | $117,600 |
| 2015 | $4,798 | $323,300 | $205,700 | $117,600 |
| 2014 | $4,306 | $298,000 | $180,400 | $117,600 |
Map
- 10 Cooper Dr
- 18 Leanne Way Unit 18
- 91 Oliver Pond Cir Unit 3
- 734 Lincoln St
- 89 Oliver Pond Cir Unit 4
- 85 Oliver Pond Cir Unit 6
- 81 Oliver Pond Cir Unit 8
- 77 Oliver Pond Cir Unit 10
- 90 Oliver Pond Cir Unit 43
- 80 Oliver Pond Cir Unit 59
- 6 Teresa Cir
- 71 Silver Fox Rd
- 47 Kingsbury Rd
- 56 Leland Rd
- 18 Anchorage Rd
- 2 Anchorage Rd
- 14 Sanford St Unit 66
- 9 Lakeshore Dr
- 118 Village St Unit A
- 16 Westfield Dr
Ask me questions while you tour the home.