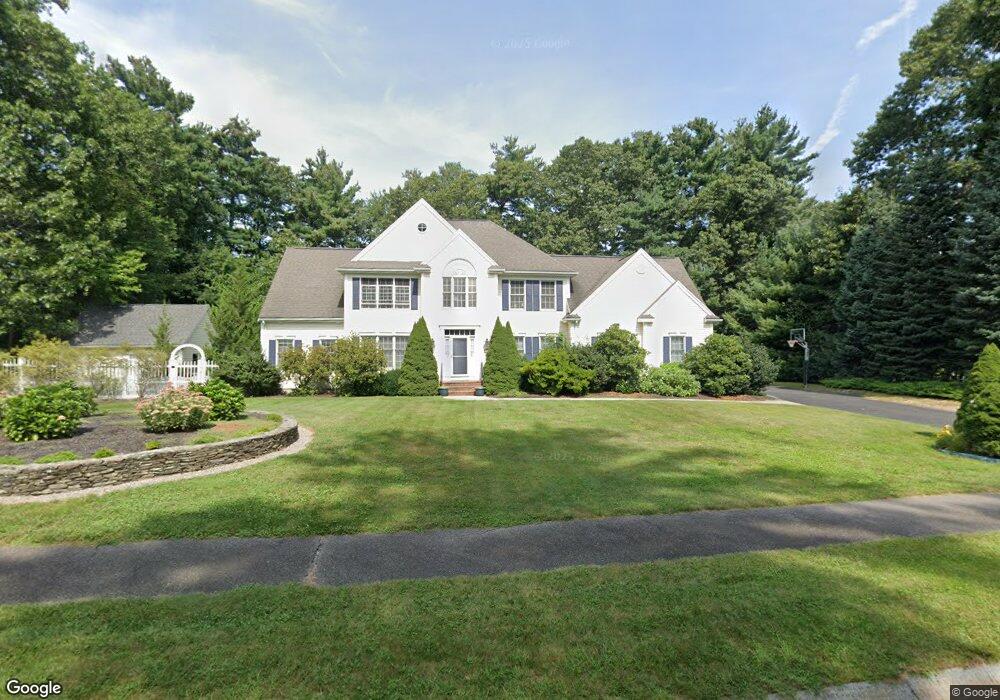
11 Lyons St Franklin, MA 02038
Wadsworth NeighborhoodEstimated Value: $1,026,257 - $1,133,000
4
Beds
4
Baths
3,551
Sq Ft
$304/Sq Ft
Est. Value
About This Home
This home is located at 11 Lyons St, Franklin, MA 02038 and is currently estimated at $1,080,314, approximately $304 per square foot. 11 Lyons St is a home located in Norfolk County with nearby schools including Jefferson Elementary School, Remington Middle School, and Franklin High School.
Ownership History
Date
Name
Owned For
Owner Type
Purchase Details
Closed on
Oct 26, 1999
Sold by
Ranteri Donald G
Bought by
Schaefer Scott E and Schaefer Joanne M
Current Estimated Value
Home Financials for this Owner
Home Financials are based on the most recent Mortgage that was taken out on this home.
Original Mortgage
$270,000
Interest Rate
7.83%
Mortgage Type
Purchase Money Mortgage
Purchase Details
Closed on
Sep 22, 1999
Sold by
Ranieri Mary E
Bought by
Sturtevant Roger and Sturtevant Kathryn A
Home Financials for this Owner
Home Financials are based on the most recent Mortgage that was taken out on this home.
Original Mortgage
$270,000
Interest Rate
7.83%
Mortgage Type
Purchase Money Mortgage
Create a Home Valuation Report for This Property
The Home Valuation Report is an in-depth analysis detailing your home's value as well as a comparison with similar homes in the area
Home Values in the Area
Average Home Value in this Area
Purchase History
| Date | Buyer | Sale Price | Title Company |
|---|---|---|---|
| Schaefer Scott E | $135,000 | -- | |
| Sturtevant Roger | $135,000 | -- |
Source: Public Records
Mortgage History
| Date | Status | Borrower | Loan Amount |
|---|---|---|---|
| Open | Sturtevant Roger | $233,000 | |
| Closed | Sturtevant Roger | $196,000 | |
| Closed | Sturtevant Roger | $270,000 | |
| Closed | Sturtevant Roger | $320,000 |
Source: Public Records
Tax History
| Year | Tax Paid | Tax Assessment Tax Assessment Total Assessment is a certain percentage of the fair market value that is determined by local assessors to be the total taxable value of land and additions on the property. | Land | Improvement |
|---|---|---|---|---|
| 2025 | $10,712 | $921,900 | $334,200 | $587,700 |
| 2024 | $10,625 | $901,200 | $334,200 | $567,000 |
| 2023 | $10,391 | $826,000 | $284,900 | $541,100 |
| 2022 | $9,876 | $702,900 | $224,300 | $478,600 |
| 2021 | $10,394 | $709,500 | $251,900 | $457,600 |
| 2020 | $9,829 | $677,400 | $241,600 | $435,800 |
| 2019 | $9,774 | $666,700 | $231,300 | $435,400 |
| 2018 | $9,005 | $614,700 | $223,000 | $391,700 |
| 2017 | $8,722 | $598,200 | $206,500 | $391,700 |
| 2016 | $8,788 | $606,100 | $221,300 | $384,800 |
| 2015 | $8,659 | $583,500 | $210,300 | $373,200 |
| 2014 | $8,057 | $557,600 | $184,400 | $373,200 |
Source: Public Records
Map
Nearby Homes
- 1 Spring St
- 18 Bubbling Brook Rd
- 900 Washington St Lot 2
- 925 Washington St
- 9 Reagan Ave
- 352 Lake St
- 9 Brookfield Ln
- 19 Geordan Ave
- 58 Douglas Dr
- 1303 Old Bridge Ln Unit 1303
- 1501 Old Bridge Ln Unit 1501
- 21 Palmetto Dr Unit 21
- 9 Pebble Cir Unit 9
- 23 Palmetto Dr Unit 23
- 24 Palmetto Dr Unit 24
- 10 Follett Dr
- 3003 Maple Brook Rd Unit 3003
- 5 Stone Ridge Rd
- 1620 West St
- 1 Washington St
Your Personal Tour Guide
Ask me questions while you tour the home.