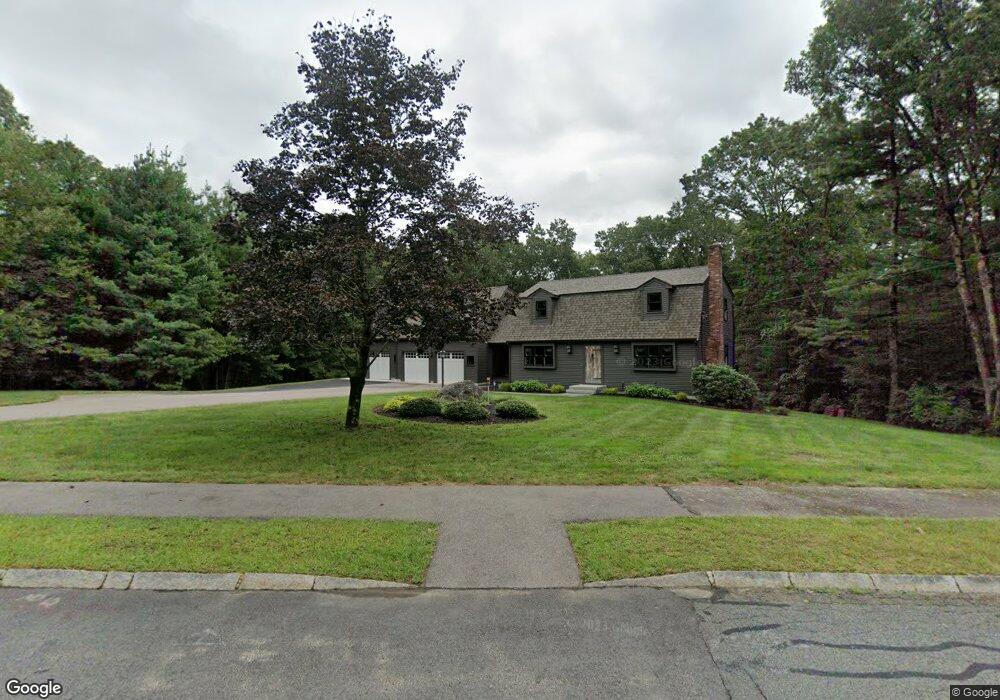
11 Michael Rd Franklin, MA 02038
Wadsworth NeighborhoodEstimated Value: $718,211 - $836,000
3
Beds
2
Baths
1,805
Sq Ft
$422/Sq Ft
Est. Value
About This Home
This home is located at 11 Michael Rd, Franklin, MA 02038 and is currently estimated at $761,303, approximately $421 per square foot. 11 Michael Rd is a home located in Norfolk County with nearby schools including Jefferson Elementary School, Remington Middle School, and Franklin High School.
Ownership History
Date
Name
Owned For
Owner Type
Purchase Details
Closed on
Jun 30, 1995
Sold by
Hurley David J and Hurley Elaine J
Bought by
Cain Sandra
Current Estimated Value
Purchase Details
Closed on
Dec 11, 1987
Sold by
Colella Bernardo
Bought by
Hurley David J
Home Financials for this Owner
Home Financials are based on the most recent Mortgage that was taken out on this home.
Original Mortgage
$170,000
Interest Rate
10.96%
Mortgage Type
Purchase Money Mortgage
Create a Home Valuation Report for This Property
The Home Valuation Report is an in-depth analysis detailing your home's value as well as a comparison with similar homes in the area
Home Values in the Area
Average Home Value in this Area
Purchase History
| Date | Buyer | Sale Price | Title Company |
|---|---|---|---|
| Cain Sandra | $177,000 | -- | |
| Hurley David J | $179,000 | -- |
Source: Public Records
Mortgage History
| Date | Status | Borrower | Loan Amount |
|---|---|---|---|
| Previous Owner | Hurley David J | $161,000 | |
| Previous Owner | Hurley David J | $170,000 |
Source: Public Records
Tax History
| Year | Tax Paid | Tax Assessment Tax Assessment Total Assessment is a certain percentage of the fair market value that is determined by local assessors to be the total taxable value of land and additions on the property. | Land | Improvement |
|---|---|---|---|---|
| 2025 | $7,402 | $637,000 | $334,400 | $302,600 |
| 2024 | $7,187 | $609,600 | $334,400 | $275,200 |
| 2023 | $7,115 | $565,600 | $290,400 | $275,200 |
| 2022 | $6,247 | $444,600 | $220,000 | $224,600 |
| 2021 | $6,113 | $417,300 | $244,600 | $172,700 |
| 2020 | $5,697 | $392,600 | $228,400 | $164,200 |
| 2019 | $5,632 | $384,200 | $220,300 | $163,900 |
| 2018 | $5,322 | $363,300 | $216,300 | $147,000 |
| 2017 | $5,091 | $349,200 | $202,200 | $147,000 |
| 2016 | $4,753 | $327,800 | $204,700 | $123,100 |
| 2015 | $4,787 | $322,600 | $199,500 | $123,100 |
| 2014 | $4,308 | $298,100 | $175,000 | $123,100 |
Source: Public Records
Map
Nearby Homes
- 9 Reagan Ave
- 1620 West St
- 1565 West St
- 10 Follett Dr
- 955 Summer St
- 900 Washington St Lot 2
- 0 Fall Ln
- 60 Grant Ave
- 18 Bubbling Brook Rd
- 440 Chestnut St
- 925 Washington St
- 1 Washington St
- 3 Washington St
- 374-378 Union St
- 613 West St
- 139 King St Unit 306
- 82 Uncas Ave
- 82 Uncas Ave Unit 1
- 99 Summer St
- 80 Uncas Ave
Your Personal Tour Guide
Ask me questions while you tour the home.