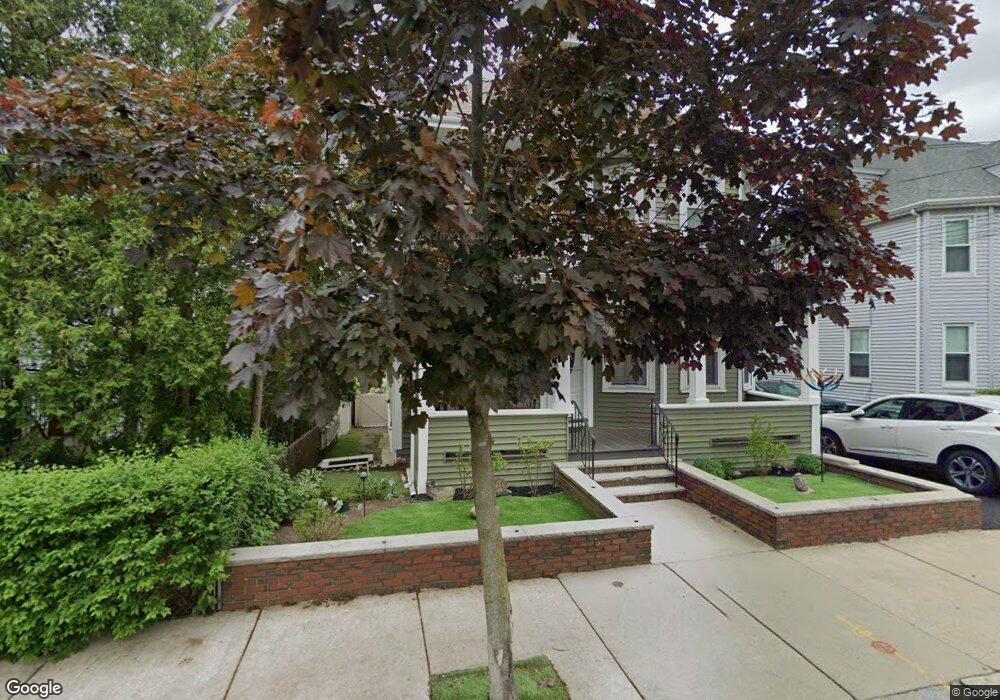
11 Orchard St Everett, MA 02149
Glendale NeighborhoodEstimated Value: $830,758 - $992,000
5
Beds
3
Baths
2,526
Sq Ft
$364/Sq Ft
Est. Value
About This Home
This home is located at 11 Orchard St, Everett, MA 02149 and is currently estimated at $920,440, approximately $364 per square foot. 11 Orchard St is a home located in Middlesex County with nearby schools including Everett High School, Pioneer Charter School of Science, and St Anthony School.
Ownership History
Date
Name
Owned For
Owner Type
Purchase Details
Closed on
Aug 10, 2020
Sold by
Dean Michael J
Bought by
Dean Karen L
Current Estimated Value
Purchase Details
Closed on
Jun 13, 2013
Sold by
Dean Karen L
Bought by
Dean Ft
Purchase Details
Closed on
Feb 20, 1987
Sold by
Dematteis Alfeo
Bought by
Dean Karen L
Home Financials for this Owner
Home Financials are based on the most recent Mortgage that was taken out on this home.
Original Mortgage
$171,900
Interest Rate
9.24%
Mortgage Type
Purchase Money Mortgage
Create a Home Valuation Report for This Property
The Home Valuation Report is an in-depth analysis detailing your home's value as well as a comparison with similar homes in the area
Home Values in the Area
Average Home Value in this Area
Purchase History
| Date | Buyer | Sale Price | Title Company |
|---|---|---|---|
| Dean Karen L | -- | None Available | |
| Dean Michael J | -- | None Available | |
| Dean Ft | -- | -- | |
| Dean Karen L | $214,900 | -- |
Source: Public Records
Mortgage History
| Date | Status | Borrower | Loan Amount |
|---|---|---|---|
| Previous Owner | Dean Karen L | $172,700 | |
| Previous Owner | Dean Karen L | $171,900 |
Source: Public Records
Tax History
| Year | Tax Paid | Tax Assessment Tax Assessment Total Assessment is a certain percentage of the fair market value that is determined by local assessors to be the total taxable value of land and additions on the property. | Land | Improvement |
|---|---|---|---|---|
| 2025 | $9,097 | $798,700 | $225,400 | $573,300 |
| 2024 | $8,514 | $742,900 | $215,600 | $527,300 |
| 2023 | $8,237 | $699,200 | $200,900 | $498,300 |
| 2022 | $6,749 | $651,400 | $191,100 | $460,300 |
| 2021 | $6,084 | $616,400 | $174,000 | $442,400 |
| 2020 | $6,474 | $608,500 | $174,000 | $434,500 |
| 2019 | $6,809 | $550,000 | $162,200 | $387,800 |
| 2018 | $6,660 | $483,300 | $141,100 | $342,200 |
| 2017 | $6,177 | $427,800 | $117,600 | $310,200 |
| 2016 | $5,702 | $394,600 | $117,600 | $277,000 |
| 2015 | $5,359 | $366,800 | $105,100 | $261,700 |
Source: Public Records
Map
Nearby Homes
- 110 Ferry St
- 20 Fairmount St
- 20 Ferry St Unit B
- 21 Hillside Ave Unit 21
- 181 Chelsea St
- 99 Florence St
- 238 Chelsea St
- 68 Linden St Unit 49
- 48 Cleveland Ave
- 24 Corey St Unit 101
- 114 Francis St
- 55 Garland St
- 15 Staples Ave Unit 45
- 15 Staples Ave Unit 31
- 21 Staples Ave Unit 26
- 378 Ferry St
- 21 Central Ave Unit 10
- 132 Vernal St
- 34 Paris St
- 139 Bucknam St
Your Personal Tour Guide
Ask me questions while you tour the home.