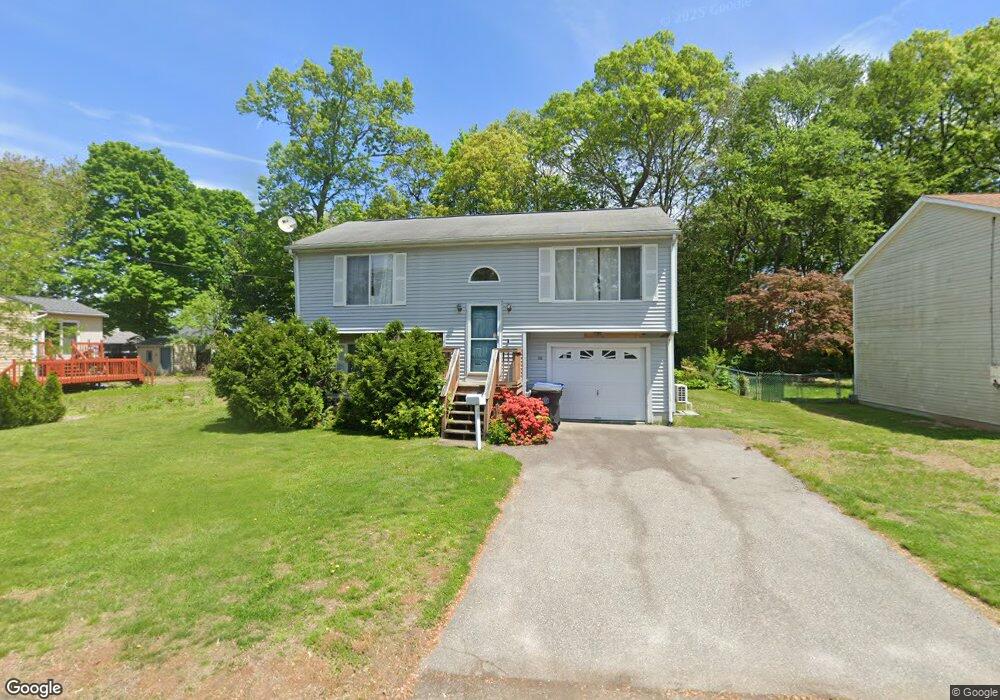
11 Regnaire Ct West Warwick, RI 02893
West Warwick Centre NeighborhoodEstimated Value: $376,000 - $404,540
3
Beds
2
Baths
1,339
Sq Ft
$295/Sq Ft
Est. Value
About This Home
This home is located at 11 Regnaire Ct, West Warwick, RI 02893 and is currently estimated at $395,135, approximately $295 per square foot. 11 Regnaire Ct is a home located in Kent County with nearby schools including West Warwick High School and Islamic School of Rhode Island.
Ownership History
Date
Name
Owned For
Owner Type
Purchase Details
Closed on
Aug 7, 2009
Sold by
Us Bk
Bought by
Plumley Robert L
Current Estimated Value
Home Financials for this Owner
Home Financials are based on the most recent Mortgage that was taken out on this home.
Original Mortgage
$128,000
Outstanding Balance
$84,557
Interest Rate
5.47%
Mortgage Type
Purchase Money Mortgage
Estimated Equity
$310,578
Purchase Details
Closed on
Jan 27, 2009
Sold by
Carbone Bobbie
Bought by
Us Bank Na
Purchase Details
Closed on
Nov 9, 2004
Sold by
Kaiser Kathleen R
Bought by
Carbone Robbi
Purchase Details
Closed on
Dec 10, 1999
Sold by
Padula Builders
Bought by
Kaiser Kathleen R
Purchase Details
Closed on
Jul 14, 1999
Sold by
Lacombe Brian G and Lacombe Dolleen A
Bought by
Padula Builders Inc
Create a Home Valuation Report for This Property
The Home Valuation Report is an in-depth analysis detailing your home's value as well as a comparison with similar homes in the area
Home Values in the Area
Average Home Value in this Area
Purchase History
| Date | Buyer | Sale Price | Title Company |
|---|---|---|---|
| Plumley Robert L | $160,000 | -- | |
| Us Bank Na | $115,800 | -- | |
| Carbone Robbi | $230,000 | -- | |
| Kaiser Kathleen R | $110,000 | -- | |
| Padula Builders Inc | $20,000 | -- |
Source: Public Records
Mortgage History
| Date | Status | Borrower | Loan Amount |
|---|---|---|---|
| Open | Padula Builders Inc | $128,000 | |
| Previous Owner | Padula Builders Inc | $228,000 |
Source: Public Records
Tax History Compared to Growth
Tax History
| Year | Tax Paid | Tax Assessment Tax Assessment Total Assessment is a certain percentage of the fair market value that is determined by local assessors to be the total taxable value of land and additions on the property. | Land | Improvement |
|---|---|---|---|---|
| 2025 | $4,303 | $301,100 | $82,300 | $218,800 |
| 2024 | $4,387 | $234,700 | $66,500 | $168,200 |
| 2023 | $4,300 | $234,700 | $66,500 | $168,200 |
| 2022 | $4,234 | $234,700 | $66,500 | $168,200 |
| 2021 | $4,467 | $194,200 | $53,200 | $141,000 |
| 2020 | $4,467 | $194,200 | $53,200 | $141,000 |
| 2019 | $5,694 | $194,200 | $53,200 | $141,000 |
| 2018 | $3,966 | $145,900 | $47,800 | $98,100 |
| 2017 | $3,839 | $145,900 | $47,800 | $98,100 |
| 2016 | $3,770 | $145,900 | $47,800 | $98,100 |
| 2015 | $3,632 | $139,900 | $47,800 | $92,100 |
| 2014 | $3,552 | $139,900 | $47,800 | $92,100 |
Source: Public Records
Map
Nearby Homes