Estimated Value: $315,000 - $341,000
3
Beds
1
Bath
1,152
Sq Ft
$282/Sq Ft
Est. Value
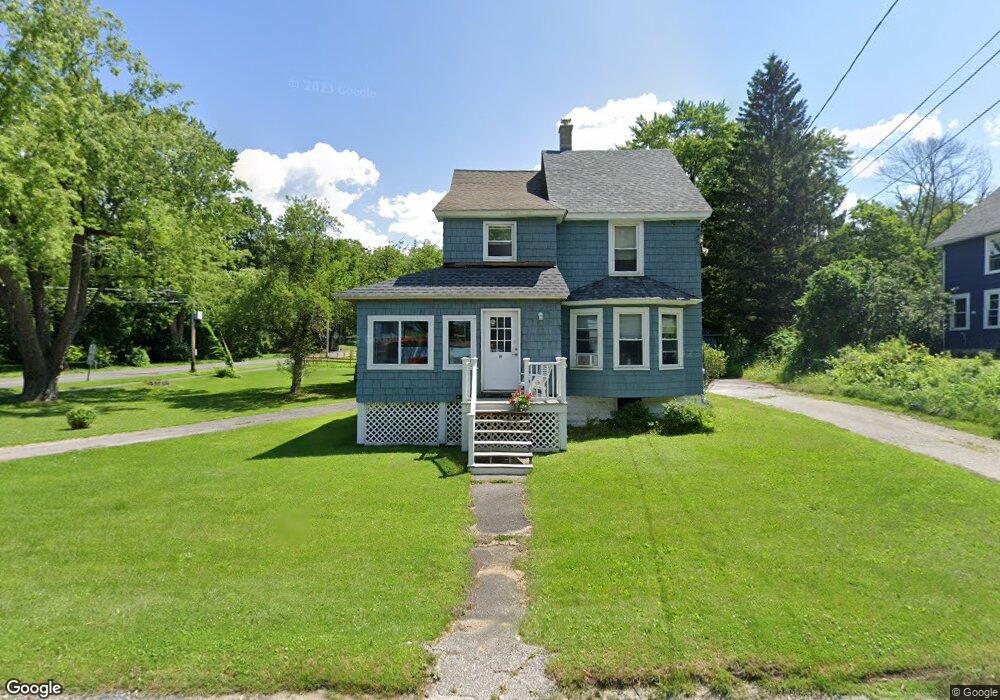
About This Home
This home is located at 11 Robert St, Lee, MA 01238 and is currently estimated at $325,119, approximately $282 per square foot. 11 Robert St is a home located in Berkshire County with nearby schools including Lee Elementary School, Lee Middle/High School, and St. Mary's School.
Ownership History
Date
Name
Owned For
Owner Type
Purchase Details
Closed on
Jun 26, 2017
Sold by
Dobson Ann M
Bought by
Dobson Ann M and Devarennes Mary L
Current Estimated Value
Purchase Details
Closed on
Oct 12, 2016
Sold by
Devarennes John J Est
Bought by
Dobson Ann M
Purchase Details
Closed on
Dec 5, 2006
Sold by
Dobson Ann M
Bought by
Dobson Ann M and Devarennes John J
Home Financials for this Owner
Home Financials are based on the most recent Mortgage that was taken out on this home.
Original Mortgage
$172,400
Interest Rate
6.36%
Mortgage Type
Purchase Money Mortgage
Create a Home Valuation Report for This Property
The Home Valuation Report is an in-depth analysis detailing your home's value as well as a comparison with similar homes in the area
Home Values in the Area
Average Home Value in this Area
Purchase History
| Date | Buyer | Sale Price | Title Company |
|---|---|---|---|
| Dobson Ann M | -- | -- | |
| Dobson Ann M | -- | -- | |
| Dobson Ann M | -- | -- |
Source: Public Records
Mortgage History
| Date | Status | Borrower | Loan Amount |
|---|---|---|---|
| Previous Owner | Dobson Ann M | $172,400 |
Source: Public Records
Tax History
| Year | Tax Paid | Tax Assessment Tax Assessment Total Assessment is a certain percentage of the fair market value that is determined by local assessors to be the total taxable value of land and additions on the property. | Land | Improvement |
|---|---|---|---|---|
| 2025 | $3,035 | $269,800 | $75,800 | $194,000 |
| 2024 | $3,176 | $282,600 | $74,300 | $208,300 |
| 2023 | $3,049 | $257,700 | $71,100 | $186,600 |
| 2022 | $3,217 | $235,700 | $94,000 | $141,700 |
| 2021 | $3,190 | $217,300 | $84,300 | $133,000 |
| 2020 | $2,836 | $193,200 | $78,900 | $114,300 |
| 2019 | $2,814 | $190,400 | $80,800 | $109,600 |
| 2018 | $2,805 | $191,700 | $80,800 | $110,900 |
| 2017 | $2,676 | $181,800 | $69,000 | $112,800 |
| 2016 | $2,618 | $179,800 | $67,000 | $112,800 |
| 2015 | $2,532 | $179,800 | $67,000 | $112,800 |
| 2014 | $2,492 | $176,100 | $67,000 | $109,100 |
Source: Public Records
Map
Nearby Homes
- 180 Center St
- 205 High St
- 30 Pease Terrace
- 131 Center St
- 290 E Center St
- 155 Laurel St
- 0 East St Unit 235893
- 135 East St
- 140 Theresa Terrace
- 2 Devon Rd
- 155 Water St Unit 5
- 615 Laurel St
- 184 Washington Mountain Rd
- 528 Walker St
- 524 Walker St
- 500 Walker St
- 45 Forest St
- 735 Cape St
- 2 Saint Andrews Ct
- 770 Summer St Unit 5D
Your Personal Tour Guide
Ask me questions while you tour the home.