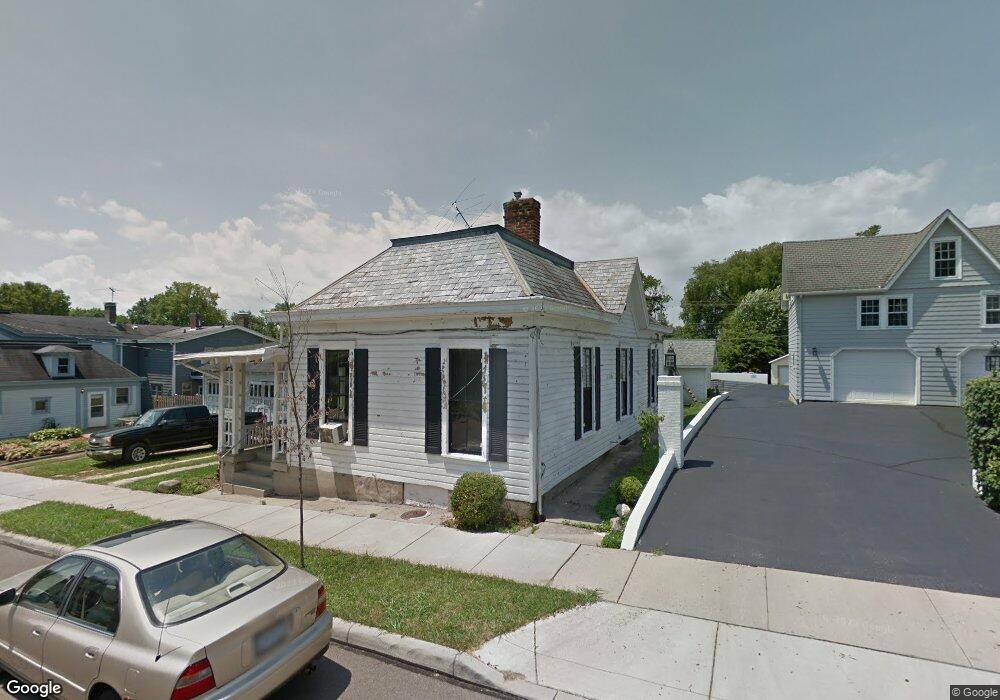
11 S High St Lebanon, OH 45036
Estimated Value: $145,000 - $186,000
2
Beds
1
Bath
1,119
Sq Ft
$151/Sq Ft
Est. Value
About This Home
This home is located at 11 S High St, Lebanon, OH 45036 and is currently estimated at $169,299, approximately $151 per square foot. 11 S High St is a home located in Warren County with nearby schools including Bowman Primary School, Berry Intermediate School, and Donovan Elementary School.
Ownership History
Date
Name
Owned For
Owner Type
Purchase Details
Closed on
Sep 4, 2024
Sold by
Hall Holly
Bought by
Hall Holly
Current Estimated Value
Purchase Details
Closed on
Jul 21, 2018
Sold by
Hall David R
Bought by
Hall David R
Purchase Details
Closed on
Oct 9, 2009
Sold by
Gallaher Hinton Joan and Gallaher Joan
Bought by
Hall Robert and Hall David
Home Financials for this Owner
Home Financials are based on the most recent Mortgage that was taken out on this home.
Original Mortgage
$32,865
Interest Rate
5.19%
Mortgage Type
FHA
Purchase Details
Closed on
Aug 2, 2000
Sold by
Rowland Ernest
Bought by
Gallagher Patrick T
Home Financials for this Owner
Home Financials are based on the most recent Mortgage that was taken out on this home.
Original Mortgage
$152,910
Interest Rate
8.19%
Mortgage Type
New Conventional
Purchase Details
Closed on
Jun 22, 1979
Sold by
Gallaher Gallaher and Gallaher Margaret F
Purchase Details
Closed on
Aug 11, 1978
Sold by
Gallaher Gallaher and Gallaher Carl J
Create a Home Valuation Report for This Property
The Home Valuation Report is an in-depth analysis detailing your home's value as well as a comparison with similar homes in the area
Home Values in the Area
Average Home Value in this Area
Purchase History
| Date | Buyer | Sale Price | Title Company |
|---|---|---|---|
| Hall Holly | -- | None Listed On Document | |
| Hall David R | -- | None Available | |
| Hall Robert | $37,000 | Middletown Title | |
| Gallagher Patrick T | $169,900 | -- | |
| -- | -- | -- | |
| -- | -- | -- |
Source: Public Records
Mortgage History
| Date | Status | Borrower | Loan Amount |
|---|---|---|---|
| Previous Owner | Hall Robert | $32,865 | |
| Previous Owner | Gallagher Patrick T | $152,910 |
Source: Public Records
Tax History Compared to Growth
Tax History
| Year | Tax Paid | Tax Assessment Tax Assessment Total Assessment is a certain percentage of the fair market value that is determined by local assessors to be the total taxable value of land and additions on the property. | Land | Improvement |
|---|---|---|---|---|
| 2024 | $1,444 | $44,570 | $15,380 | $29,190 |
| 2023 | $774 | $33,484 | $7,567 | $25,917 |
| 2022 | $1,647 | $33,485 | $7,567 | $25,918 |
| 2021 | $1,556 | $33,485 | $7,567 | $25,918 |
| 2020 | $1,497 | $27,223 | $6,153 | $21,070 |
| 2019 | $1,504 | $27,223 | $6,153 | $21,070 |
| 2018 | $271 | $14,581 | $6,153 | $8,428 |
| 2017 | $678 | $21,858 | $5,691 | $16,167 |
| 2016 | $700 | $21,858 | $5,691 | $16,167 |
| 2015 | $705 | $21,858 | $5,691 | $16,167 |
| 2014 | $654 | $20,430 | $5,320 | $15,110 |
| 2013 | $629 | $23,630 | $6,150 | $17,480 |
Source: Public Records
Map
Nearby Homes
- N Ohio 123
- Lot Ohio 123
- 441 Bethpage Way
- 429 Bethpage Way
- 437 Bethpage Way Unit 7-303
- 429 Bethpage Way Unit 7-203
- 425 Bethpage Way Unit 7-202
- 401 Bethpage Way Unit 7-201
- 441 Bethpage Way Unit 7-305
- 440 E Main St
- 324 E Warren St
- 4377 Waters Edge Ln
- 417 E Warren St
- 463 Valhalla Ct Unit 9-202
- 16 Mound St
- 206 Wright Ave
- 17 W Silver St
- 10 N Sycamore St
- 320 N Mechanic St
- 513 E Warren St
- 11 N High St
- 332 E Main St
- 328 E Main St
- 320 E Main St
- 402 E Main St
- 16 S High St
- 6 S High St
- 402 E 402 E Main St St
- 12 S High St
- 8 S High St
- 406 E Main St
- 0 Ohio 48 Unit 1795009
- 0 Ohio 48 Unit 904144
- 0 Ohio 48 Unit 1774176
- 0 Ohio 48 Unit 396616
- 314 E Main St
- 314 W Main St
- 403 E Mulberry St
- 319 E Mulberry St
- 410 E Main St