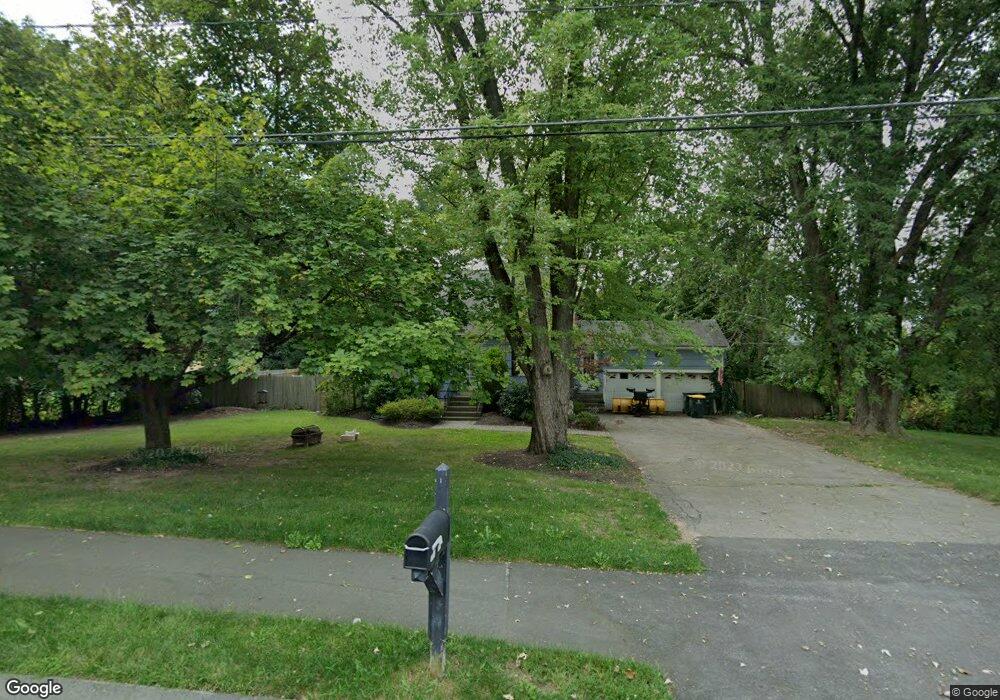
11 Skyline Dr Franklin, MA 02038
Estimated Value: $621,000 - $700,000
3
Beds
2
Baths
1,700
Sq Ft
$385/Sq Ft
Est. Value
About This Home
This home is located at 11 Skyline Dr, Franklin, MA 02038 and is currently estimated at $654,627, approximately $385 per square foot. 11 Skyline Dr is a home located in Norfolk County with nearby schools including Helen Keller Elementary School, Annie Sullivan Middle School, and Franklin High School.
Ownership History
Date
Name
Owned For
Owner Type
Purchase Details
Closed on
Jan 30, 2006
Sold by
Fitzhenry Scott
Bought by
Donovan Amy Fr and Donovan Benjamin M
Current Estimated Value
Home Financials for this Owner
Home Financials are based on the most recent Mortgage that was taken out on this home.
Original Mortgage
$301,600
Outstanding Balance
$171,194
Interest Rate
6.34%
Mortgage Type
Purchase Money Mortgage
Estimated Equity
$483,433
Purchase Details
Closed on
Jul 11, 1996
Sold by
Melanson Denise
Bought by
Fitzhenry Scott
Purchase Details
Closed on
May 20, 1994
Sold by
Moodie Craig and Moodie Ellen A
Bought by
Melanson Denise
Purchase Details
Closed on
Apr 7, 1989
Sold by
Collura R Paul
Bought by
Moodie Craig
Create a Home Valuation Report for This Property
The Home Valuation Report is an in-depth analysis detailing your home's value as well as a comparison with similar homes in the area
Home Values in the Area
Average Home Value in this Area
Purchase History
| Date | Buyer | Sale Price | Title Company |
|---|---|---|---|
| Donovan Amy Fr | $377,000 | -- | |
| Fitzhenry Scott | $19,000 | -- | |
| Melanson Denise | $158,500 | -- | |
| Moodie Craig | $167,500 | -- |
Source: Public Records
Mortgage History
| Date | Status | Borrower | Loan Amount |
|---|---|---|---|
| Open | Donovan Amy Fr | $301,600 | |
| Closed | Donovan Amy Fr | $75,400 | |
| Previous Owner | Moodie Craig | $25,000 | |
| Previous Owner | Moodie Craig | $149,500 |
Source: Public Records
Tax History Compared to Growth
Tax History
| Year | Tax Paid | Tax Assessment Tax Assessment Total Assessment is a certain percentage of the fair market value that is determined by local assessors to be the total taxable value of land and additions on the property. | Land | Improvement |
|---|---|---|---|---|
| 2025 | $6,470 | $556,800 | $326,400 | $230,400 |
| 2024 | $6,467 | $548,500 | $326,400 | $222,100 |
| 2023 | $6,349 | $504,700 | $278,200 | $226,500 |
| 2022 | $5,909 | $420,600 | $219,100 | $201,500 |
| 2021 | $5,999 | $409,500 | $246,000 | $163,500 |
| 2020 | $5,689 | $392,100 | $235,900 | $156,200 |
| 2019 | $5,603 | $382,200 | $225,800 | $156,400 |
| 2018 | $5,265 | $359,400 | $217,700 | $141,700 |
| 2017 | $5,005 | $343,300 | $201,600 | $141,700 |
| 2016 | $4,981 | $343,500 | $216,500 | $127,000 |
| 2015 | $4,937 | $332,700 | $205,700 | $127,000 |
| 2014 | $4,442 | $307,400 | $180,400 | $127,000 |
Source: Public Records
Map
Nearby Homes
- 2 Skyline Dr
- 732 Lincoln St
- 24 Shayne Rd Unit 219
- 48 Leanne Way Unit 48
- 83 Oliver Pond Cir Unit 7
- 91 Oliver Pond Cir Unit 3
- 841 Lincoln St
- 7 Gloucester Dr
- 56 Fuller Place
- 0 Elm St
- 312 Eagles Nest Way Unit 312
- 14 Sanford St Unit 15
- 9 Sanford St
- 10 Populatic Street Extension
- 70 Daniels St
- 10 Silver Fox Rd
- 99 Leland Rd
- 20 Broad St Unit 6
- 20 Broad St Unit A
- 20 Broad St Unit 4