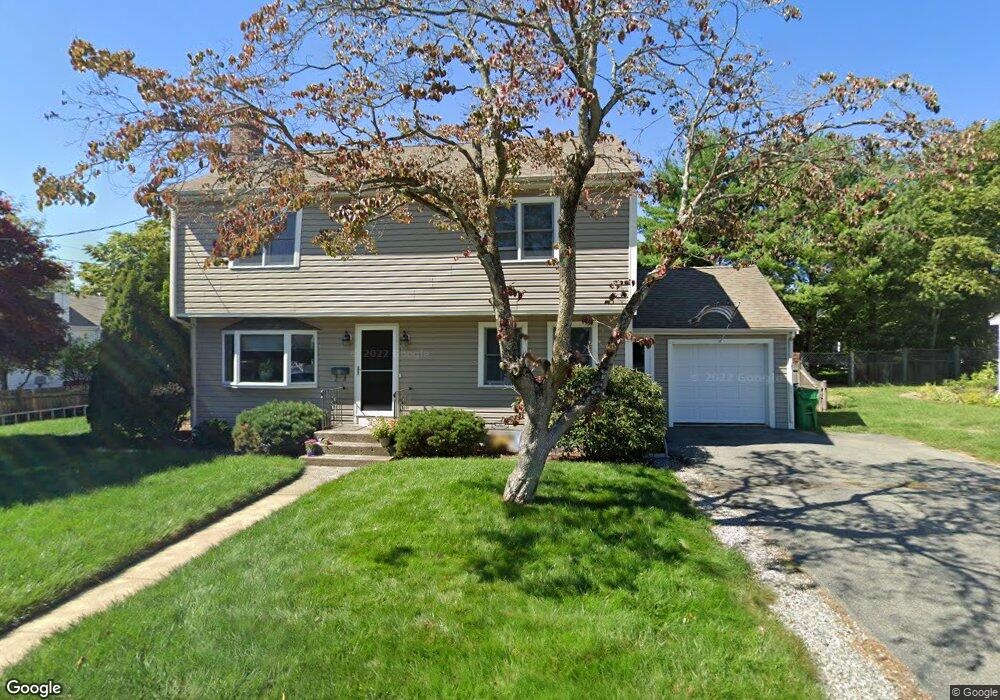
11 Smith Ave West Newton, MA 02465
West Newton NeighborhoodEstimated Value: $1,168,000 - $1,338,000
3
Beds
2
Baths
1,801
Sq Ft
$698/Sq Ft
Est. Value
About This Home
This home is located at 11 Smith Ave, West Newton, MA 02465 and is currently estimated at $1,256,411, approximately $697 per square foot. 11 Smith Ave is a home located in Middlesex County with nearby schools including C.C. Burr, Franklin Elementary School, and F.A. Day Middle School.
Ownership History
Date
Name
Owned For
Owner Type
Purchase Details
Closed on
Jan 30, 2015
Sold by
Lopez 3Rd Felix J and Lopez Karen A
Bought by
Lopez 3Rd Felix J
Current Estimated Value
Home Financials for this Owner
Home Financials are based on the most recent Mortgage that was taken out on this home.
Original Mortgage
$532,500
Outstanding Balance
$411,437
Interest Rate
4%
Mortgage Type
Adjustable Rate Mortgage/ARM
Estimated Equity
$844,974
Purchase Details
Closed on
Jul 22, 1993
Sold by
Tramontozzi Janice
Bought by
Lopez Felix J and Lopez Karen
Create a Home Valuation Report for This Property
The Home Valuation Report is an in-depth analysis detailing your home's value as well as a comparison with similar homes in the area
Home Values in the Area
Average Home Value in this Area
Purchase History
| Date | Buyer | Sale Price | Title Company |
|---|---|---|---|
| Lopez 3Rd Felix J | -- | -- | |
| Lopez Felix J | $34,000 | -- |
Source: Public Records
Mortgage History
| Date | Status | Borrower | Loan Amount |
|---|---|---|---|
| Open | Lopez 3Rd Felix J | $532,500 | |
| Previous Owner | Lopez Felix J | $309,000 | |
| Previous Owner | Lopez Felix J | $306,000 | |
| Previous Owner | Lopez Felix J | $306,000 |
Source: Public Records
Tax History Compared to Growth
Tax History
| Year | Tax Paid | Tax Assessment Tax Assessment Total Assessment is a certain percentage of the fair market value that is determined by local assessors to be the total taxable value of land and additions on the property. | Land | Improvement |
|---|---|---|---|---|
| 2025 | $9,988 | $1,019,200 | $777,000 | $242,200 |
| 2024 | $9,658 | $989,500 | $754,400 | $235,100 |
| 2023 | $9,116 | $895,500 | $570,600 | $324,900 |
| 2022 | $8,723 | $829,200 | $528,300 | $300,900 |
| 2021 | $8,418 | $782,300 | $498,400 | $283,900 |
| 2020 | $8,167 | $782,300 | $498,400 | $283,900 |
| 2019 | $7,937 | $759,500 | $483,900 | $275,600 |
| 2018 | $7,597 | $702,100 | $439,300 | $262,800 |
| 2017 | $7,366 | $662,400 | $414,400 | $248,000 |
| 2016 | $7,045 | $619,100 | $387,300 | $231,800 |
| 2015 | $6,718 | $578,600 | $362,000 | $216,600 |
Source: Public Records
Map
Nearby Homes
- 56 Dearborn St
- 265-267 River St Unit 267
- 265-267 River St Unit 265
- 33 Lill Ave
- 44 Westland Ave
- 90 Auburndale Ave
- 14 Cottage Place Unit 14
- 106 River St Unit 18
- 106 River St Unit 2
- 106 River St Unit 14
- 2 Elm St Unit 6
- 2 Elm St Unit 8
- 287 Cherry St Unit 2
- 101-103 Lexington St
- 371 Cherry St
- 41 Kilburn Rd
- 160 Pine St Unit 12
- 66 Webster St
- 10 Crescent St Unit 1
- 10 Crescent St Unit 2
- 19 Smith Ave
- 217 River St
- 124 Sheridan St
- 5 Rose Dr
- 5 Rose Dr Unit 1
- 225A River St Unit 225A
- 225A River St Unit A
- 225 River St Unit B
- 225 River St Unit A
- 223 River St
- 225 River St Unit B 223-225
- 207 River St Unit 209
- 207 River St Unit 2
- 4 Rose Dr
- 23 Smith Ave
- 11 Rose Dr
- 112 Sheridan St
- 229 River St
- 229 River St
- 229 River St Unit 1