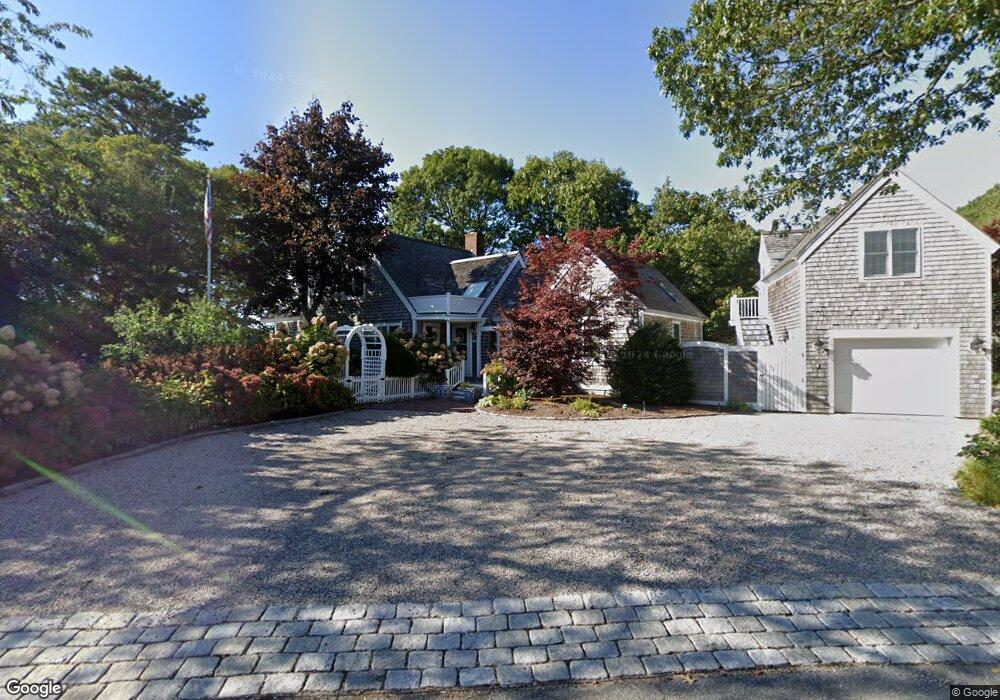
11 Taffrail Way Mashpee, MA 02649
New Seabury-Popponesset Island NeighborhoodEstimated Value: $2,456,531 - $3,628,000
5
Beds
5
Baths
3,200
Sq Ft
$863/Sq Ft
Est. Value
About This Home
This home is located at 11 Taffrail Way, Mashpee, MA 02649 and is currently estimated at $2,761,133, approximately $862 per square foot. 11 Taffrail Way is a home located in Barnstable County with nearby schools including Kenneth C. Coombs School, Quashnet School, and Mashpee Middle School.
Ownership History
Date
Name
Owned For
Owner Type
Purchase Details
Closed on
Sep 15, 2017
Sold by
Fields Warren Q and Fields Kim R
Bought by
Lee Gregory R and Lee Hillery
Current Estimated Value
Home Financials for this Owner
Home Financials are based on the most recent Mortgage that was taken out on this home.
Original Mortgage
$1,320,000
Outstanding Balance
$1,103,181
Interest Rate
3.93%
Mortgage Type
Unknown
Estimated Equity
$1,657,952
Purchase Details
Closed on
Oct 31, 2005
Sold by
Chang-Litvack Bertha and Litvack Kenneth E
Bought by
Fields Kim R and Fields Warren Q
Home Financials for this Owner
Home Financials are based on the most recent Mortgage that was taken out on this home.
Original Mortgage
$1,113,000
Interest Rate
5.79%
Mortgage Type
Purchase Money Mortgage
Purchase Details
Closed on
Nov 10, 1994
Sold by
11 Taffrail Way Rt and Tedesschi Theodore
Bought by
Litvack Kenneth E and Litvack Bertha Chang
Home Financials for this Owner
Home Financials are based on the most recent Mortgage that was taken out on this home.
Original Mortgage
$150,000
Interest Rate
8.78%
Mortgage Type
Purchase Money Mortgage
Create a Home Valuation Report for This Property
The Home Valuation Report is an in-depth analysis detailing your home's value as well as a comparison with similar homes in the area
Home Values in the Area
Average Home Value in this Area
Purchase History
| Date | Buyer | Sale Price | Title Company |
|---|---|---|---|
| Lee Gregory R | $1,650,000 | -- | |
| Fields Kim R | $1,590,000 | -- | |
| Litvack Kenneth E | $275,000 | -- |
Source: Public Records
Mortgage History
| Date | Status | Borrower | Loan Amount |
|---|---|---|---|
| Open | Lee Gregory R | $1,320,000 | |
| Previous Owner | Fields Kim R | $1,113,000 | |
| Previous Owner | Litvack Kenneth E | $150,000 |
Source: Public Records
Tax History
| Year | Tax Paid | Tax Assessment Tax Assessment Total Assessment is a certain percentage of the fair market value that is determined by local assessors to be the total taxable value of land and additions on the property. | Land | Improvement |
|---|---|---|---|---|
| 2025 | $15,123 | $2,284,400 | $1,418,700 | $865,700 |
| 2024 | $13,604 | $2,115,700 | $1,289,900 | $825,800 |
| 2023 | $13,440 | $1,917,300 | $1,228,200 | $689,100 |
| 2022 | $13,367 | $1,636,100 | $1,064,300 | $571,800 |
| 2021 | $3,606 | $1,556,600 | $1,053,400 | $503,200 |
| 2020 | $3,492 | $1,505,000 | $1,013,100 | $491,900 |
| 2019 | $13,340 | $1,474,000 | $1,013,100 | $460,900 |
| 2018 | $12,678 | $1,421,300 | $1,013,100 | $408,200 |
| 2017 | $2,765 | $1,414,400 | $1,013,100 | $401,300 |
| 2016 | $12,835 | $1,389,100 | $1,013,100 | $376,000 |
| 2015 | $12,503 | $1,372,500 | $1,013,100 | $359,400 |
| 2014 | $12,756 | $1,358,500 | $999,300 | $359,200 |
Source: Public Records
Map
Nearby Homes
- 160 Waterway
- 16 Bosun's Ln
- 16 Bosuns Ln
- 109 Waterway
- 30 Bright Coves Way
- 71 Shore Dr
- 36 Little Neck Ln
- 140 Summersea Rd
- 444 Vineyard Rd
- 14 Azalea Ln
- 42 Kim Path
- 128 Uncle Percys Rd
- 37 The Hunt Cir
- 52 Old Dock Ln
- 21 Saltwater Cir
- 17 Degrass Rd
- 36 Rosewood Cir
- 12 Tracey Rd
- 251 Shore Dr Unit D2
- 251 Shore Dr Unit D2
- 21 Taffrail Way
- 17 Taffrail Way
- 9 Bight Cir
- 16 Taffrail Way
- 75 Popponesset Island Rd
- 67 Popponesset Island Rd
- 7 Bight Cir
- 22 Taffrail Way
- 25 Taffrail Way
- 6 Bight Cir
- 85 Popponesset Island Rd
- 24 Taffrail Way
- 3 Bight Cir
- 89 Popponesset Island Rd
- 70 Popponesset Island Rd
- 51 Popponesset Island Rd
- 78 Popponesset Island Rd
- 95 Popponesset Island Rd
- 64 Popponesset Island Rd
- 23 Cross Tree Ln
Your Personal Tour Guide
Ask me questions while you tour the home.