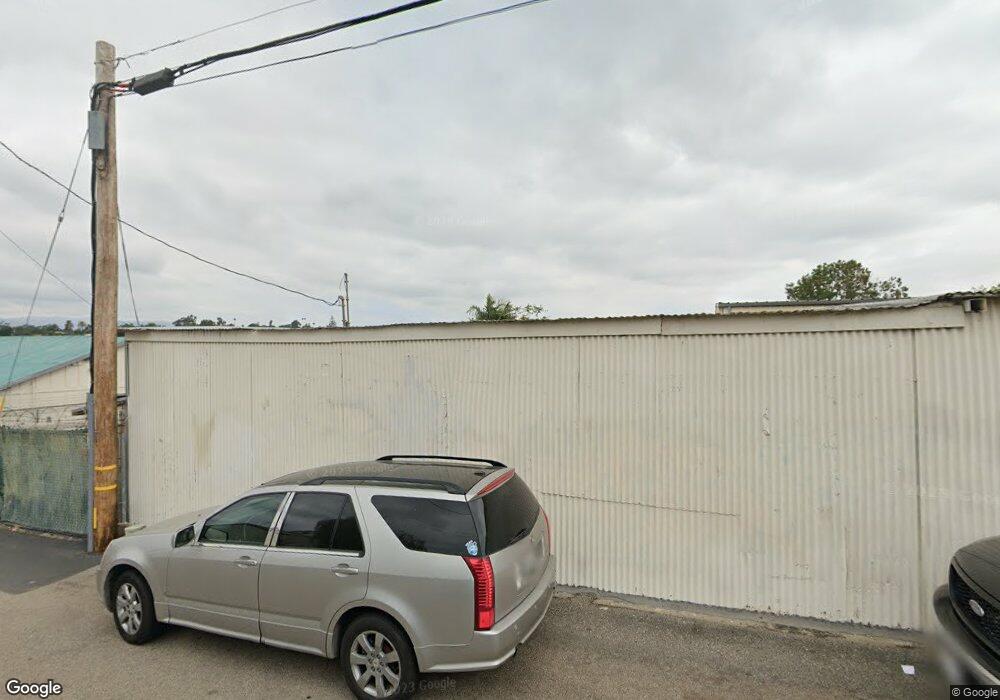
110 E Aviation Rd Fallbrook, CA 92028
Estimated Value: $1,293,438
Studio
--
Bath
4,464
Sq Ft
$290/Sq Ft
Est. Value
About This Home
This home is located at 110 E Aviation Rd, Fallbrook, CA 92028 and is currently estimated at $1,293,438, approximately $289 per square foot. 110 E Aviation Rd is a home located in San Diego County with nearby schools including La Paloma Elementary School, James E. Potter Intermediate School, and Fallbrook High School.
Ownership History
Date
Name
Owned For
Owner Type
Purchase Details
Closed on
Mar 21, 2014
Sold by
D & R Resources Inc
Bought by
Mcvest Llc
Current Estimated Value
Home Financials for this Owner
Home Financials are based on the most recent Mortgage that was taken out on this home.
Original Mortgage
$487,500
Interest Rate
4.25%
Mortgage Type
Commercial
Purchase Details
Closed on
Aug 18, 1997
Sold by
East Brothers Grove Service Inc
Bought by
D & R Resources Inc
Create a Home Valuation Report for This Property
The Home Valuation Report is an in-depth analysis detailing your home's value as well as a comparison with similar homes in the area
Home Values in the Area
Average Home Value in this Area
Purchase History
| Date | Buyer | Sale Price | Title Company |
|---|---|---|---|
| Mcvest Llc | $650,000 | First American Title Ins Co | |
| D & R Resources Inc | -- | -- |
Source: Public Records
Mortgage History
| Date | Status | Borrower | Loan Amount |
|---|---|---|---|
| Previous Owner | Mcvest Llc | $487,500 |
Source: Public Records
Tax History
| Year | Tax Paid | Tax Assessment Tax Assessment Total Assessment is a certain percentage of the fair market value that is determined by local assessors to be the total taxable value of land and additions on the property. | Land | Improvement |
|---|---|---|---|---|
| 2025 | $8,392 | $796,800 | $384,917 | $411,883 |
| 2024 | $8,392 | $781,177 | $377,370 | $403,807 |
| 2023 | $8,140 | $765,861 | $369,971 | $395,890 |
| 2022 | $8,143 | $750,845 | $362,717 | $388,128 |
| 2021 | $7,891 | $736,123 | $355,605 | $380,518 |
| 2020 | $7,966 | $728,576 | $351,959 | $376,617 |
| 2019 | $7,825 | $714,291 | $345,058 | $369,233 |
| 2018 | $7,707 | $700,287 | $338,293 | $361,994 |
| 2017 | $750 | $686,557 | $331,660 | $354,897 |
| 2016 | $7,408 | $673,096 | $325,157 | $347,939 |
| 2015 | $7,240 | $662,986 | $320,273 | $342,713 |
| 2014 | $4,251 | $385,770 | $341,824 | $43,946 |
Source: Public Records
Map
Nearby Homes
- 1024 Kiel Rd
- 522 S Pico Ave
- 206 Via Oro Verde
- 508 Village View Place
- 210 S Orange Ave
- 502 E Elder St
- 445 Poets Square
- 535 Shady Glen Dr
- 214 Summit Ave
- 741 Rossiter Ln
- 1455 Alturas Rd Unit 46
- 1455 Alturas Rd Unit 89
- 1455 Alturas Rd Unit 55
- 0 Laurine Ln
- 0 Via Vonnie Unit SW26054903
- 408 N Pico Ave
- 956 Woodcreek Rd
- 1003 Via Unidos
- 868 E Alvarado St Unit 7
- 868 E Alvarado St Unit 47
- 110 110 E Aviation Rd
- S Main Ave S
- 928 S Main Ave
- 920 S Main Ave
- 218 E Aviation Rd
- 909 S Main Ave
- 145 E Aviation Rd Unit 4A
- 145 E Aviation Rd Unit 27
- 145 E Aviation Rd Unit 22
- 145 E Aviation Rd Unit 20
- 145 E Aviation Rd Unit 10
- 145 E Aviation Rd
- 1067 S Main Ave
- 115 W Aviation Rd
- 1035 1035 S Main Ave
- 228 E Aviation Rd
- 117 W Aviation Rd
- 1063 Old Stage Rd
- 119 W Aviation Rd
- 1055 S Main Ave
Your Personal Tour Guide
Ask me questions while you tour the home.