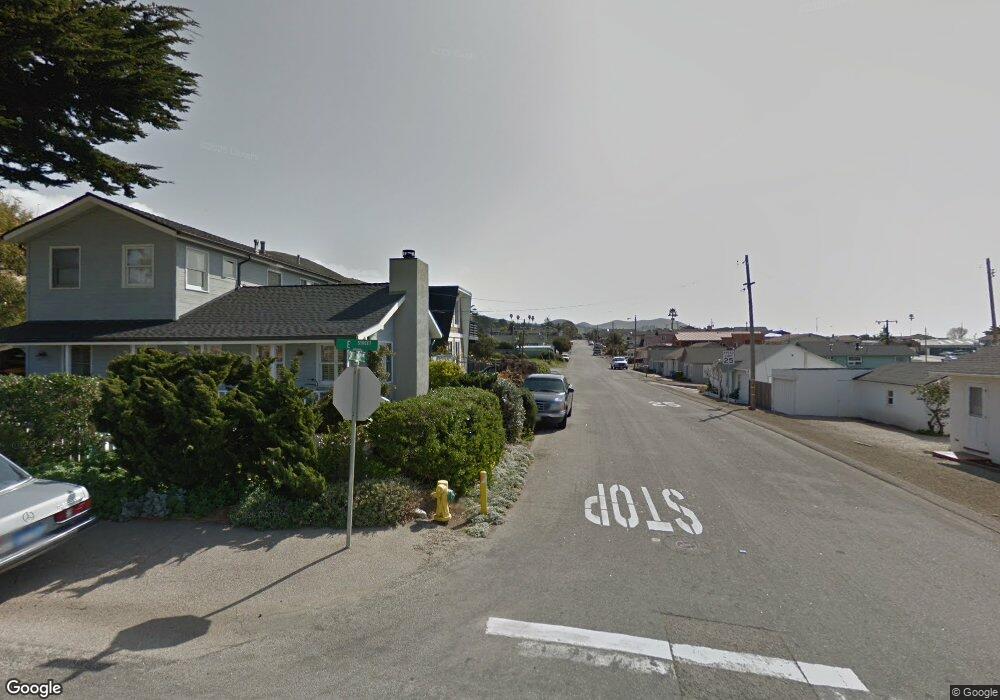
110 E St Cayucos, CA 93430
Cayucos NeighborhoodEstimated Value: $2,538,259
2
Beds
3
Baths
1,679
Sq Ft
$1,512/Sq Ft
Est. Value
About This Home
This home is located at 110 E St, Cayucos, CA 93430 and is currently estimated at $2,538,259, approximately $1,511 per square foot. 110 E St is a home located in San Luis Obispo County.
Ownership History
Date
Name
Owned For
Owner Type
Purchase Details
Closed on
Jun 30, 2021
Sold by
Martella Robin W and Robin W Martella Revocable Tru
Bought by
Olivia Aguirre Jesus A and Renderos Edna M
Current Estimated Value
Home Financials for this Owner
Home Financials are based on the most recent Mortgage that was taken out on this home.
Original Mortgage
$1,105,000
Outstanding Balance
$1,003,534
Interest Rate
2.96%
Mortgage Type
Credit Line Revolving
Estimated Equity
$1,534,725
Purchase Details
Closed on
May 14, 2021
Sold by
Stout Merrianne
Bought by
Martella Robin W and Robin W Martella Revocable Tru
Home Financials for this Owner
Home Financials are based on the most recent Mortgage that was taken out on this home.
Original Mortgage
$1,105,000
Outstanding Balance
$1,003,534
Interest Rate
2.96%
Mortgage Type
Credit Line Revolving
Estimated Equity
$1,534,725
Purchase Details
Closed on
Apr 28, 2014
Sold by
Stout Jeff
Bought by
Stout Merrianne
Purchase Details
Closed on
Dec 5, 2012
Sold by
Voiny Investment Company
Bought by
Stout Merrianne
Purchase Details
Closed on
Dec 28, 2011
Sold by
Rutledge Daniel K
Bought by
Volny Investment Company
Purchase Details
Closed on
Dec 29, 2008
Sold by
Volny Investment Company
Bought by
Rutledge Daniel K
Home Financials for this Owner
Home Financials are based on the most recent Mortgage that was taken out on this home.
Original Mortgage
$2,587,000
Interest Rate
6.03%
Mortgage Type
Seller Take Back
Purchase Details
Closed on
Dec 24, 2008
Sold by
Rutledge Connie L
Bought by
Rutledge Daniel K
Home Financials for this Owner
Home Financials are based on the most recent Mortgage that was taken out on this home.
Original Mortgage
$2,587,000
Interest Rate
6.03%
Mortgage Type
Seller Take Back
Purchase Details
Closed on
Nov 22, 2006
Sold by
David B Okun M D F A C P and Okun David B
Bought by
Volny Investment Co
Purchase Details
Closed on
Apr 14, 2004
Sold by
Miles Rodney C
Bought by
Okun David B
Purchase Details
Closed on
Oct 31, 2002
Sold by
Victorian Inn Partnership
Bought by
Cayhot Inc
Home Financials for this Owner
Home Financials are based on the most recent Mortgage that was taken out on this home.
Original Mortgage
$610,000
Interest Rate
5.89%
Mortgage Type
Construction
Purchase Details
Closed on
Jan 11, 1995
Sold by
Longmire Robert L and Longmire Kathleen
Bought by
Victorian Inn Partnership
Home Financials for this Owner
Home Financials are based on the most recent Mortgage that was taken out on this home.
Original Mortgage
$185,000
Interest Rate
9.16%
Mortgage Type
Seller Take Back
Create a Home Valuation Report for This Property
The Home Valuation Report is an in-depth analysis detailing your home's value as well as a comparison with similar homes in the area
Home Values in the Area
Average Home Value in this Area
Purchase History
| Date | Buyer | Sale Price | Title Company |
|---|---|---|---|
| Olivia Aguirre Jesus A | $2,175,000 | Fidelity National Title Co | |
| Martella Robin W | -- | None Available | |
| Stout Merrianne | -- | First American Title Company | |
| Stout Merrianne | -- | First American Title Company | |
| Volny Investment Company | -- | None Available | |
| Rutledge Daniel K | $2,588,000 | First American Title Company | |
| Rutledge Daniel K | -- | First American Title Company | |
| Volny Investment Co | $1,145,000 | First American Title Co | |
| Okun David B | $950,000 | None Available | |
| Cayhot Inc | $760,000 | First American Title Company | |
| Victorian Inn Partnership | $255,000 | First American Title Ins Co |
Source: Public Records
Mortgage History
| Date | Status | Borrower | Loan Amount |
|---|---|---|---|
| Open | Olivia Aguirre Jesus A | $1,105,000 | |
| Previous Owner | Rutledge Daniel K | $2,587,000 | |
| Previous Owner | Cayhot Inc | $610,000 | |
| Previous Owner | Victorian Inn Partnership | $185,000 |
Source: Public Records
Tax History
| Year | Tax Paid | Tax Assessment Tax Assessment Total Assessment is a certain percentage of the fair market value that is determined by local assessors to be the total taxable value of land and additions on the property. | Land | Improvement |
|---|---|---|---|---|
| 2025 | $23,935 | $2,308,126 | $742,845 | $1,565,281 |
| 2024 | $23,678 | $2,262,870 | $728,280 | $1,534,590 |
| 2023 | $23,678 | $2,218,500 | $714,000 | $1,504,500 |
| 2022 | $23,281 | $2,175,000 | $700,000 | $1,475,000 |
| 2021 | $20,429 | $1,803,569 | $928,653 | $874,916 |
| 2020 | $19,250 | $1,785,076 | $919,131 | $865,945 |
| 2019 | $18,872 | $1,750,075 | $901,109 | $848,966 |
| 2018 | $18,501 | $1,715,761 | $883,441 | $832,320 |
| 2017 | $18,135 | $1,682,119 | $866,119 | $816,000 |
| 2016 | $17,778 | $849,137 | $849,137 | $0 |
| 2015 | $9,174 | $836,383 | $836,383 | $0 |
| 2014 | $3,270 | $307,389 | $307,389 | $0 |
Source: Public Records
Map
Nearby Homes
- 0 Ash Ave Unit SC25116716
- 340 D St
- 77 N Ocean Ave Unit 8
- 77 N Ocean Ave Unit 12
- 159 Ash Ave
- 130 Cypress Ave
- 191 J St
- 31 N 3rd St
- 50 S 3rd St
- 349 N Ocean Ave Unit A13
- 349 N Ocean Ave Unit A3
- 510 Park Ave
- 50 5th St
- 557 Lucerne St
- 1000 Saint Mary Ave
- 1234 Pacific Ave
- 1625 Cass Ave Unit 22
- 57 17th St
- 2023 Circle Dr
- 96 24th St
- 150 E St
- 7 Saint Mary Ave
- 14 Saint Mary Ave
- 160 E St
- 1 Ash Ave
- 151 F St
- 12 Saint Mary Ave
- 166 E St
- 155 F St
- 163 F St
- 0 Ash Ave Unit CRSC25116716
- 0 Ash Ave Unit 4 976080
- 0 Ash Ave Unit 2 976082
- 0 Ash Ave Unit 3 976081
- 0 Ash Ave Unit 5 976079
- 0 Ash Ave Unit 1 976076
- 0 Ash Ave
- 11 Ash Ave
- 5 S Ocean Ave
- 26 Saint Mary Ave
Your Personal Tour Guide
Ask me questions while you tour the home.