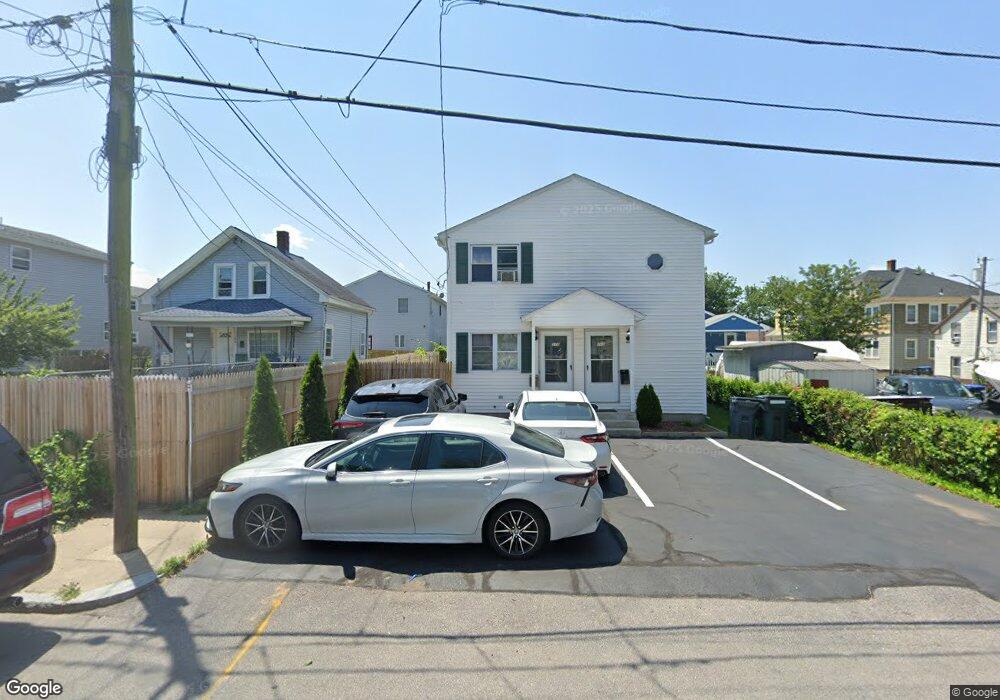
110 Russo St Unit 112 Providence, RI 02904
Charles NeighborhoodEstimated Value: $488,000 - $577,000
4
Beds
2
Baths
2,600
Sq Ft
$203/Sq Ft
Est. Value
About This Home
This home is located at 110 Russo St Unit 112, Providence, RI 02904 and is currently estimated at $527,104, approximately $202 per square foot. 110 Russo St Unit 112 is a home located in Providence County with nearby schools including Asa Messer Elementary School, Charles N. Fortes Elementary School, and Veazie Street Elementary School.
Ownership History
Date
Name
Owned For
Owner Type
Purchase Details
Closed on
Jan 3, 2005
Sold by
Smith Regina
Bought by
Taiwo Babatunde O
Current Estimated Value
Home Financials for this Owner
Home Financials are based on the most recent Mortgage that was taken out on this home.
Original Mortgage
$243,650
Outstanding Balance
$122,020
Interest Rate
5.73%
Mortgage Type
Purchase Money Mortgage
Estimated Equity
$405,084
Purchase Details
Closed on
Jun 29, 2001
Sold by
Lowry Michael T and Lowry Therese J
Bought by
Smith Regina
Create a Home Valuation Report for This Property
The Home Valuation Report is an in-depth analysis detailing your home's value as well as a comparison with similar homes in the area
Home Values in the Area
Average Home Value in this Area
Purchase History
| Date | Buyer | Sale Price | Title Company |
|---|---|---|---|
| Taiwo Babatunde O | $247,500 | -- | |
| Smith Regina | $115,000 | -- |
Source: Public Records
Mortgage History
| Date | Status | Borrower | Loan Amount |
|---|---|---|---|
| Open | Smith Regina | $19,500 | |
| Open | Smith Regina | $243,650 | |
| Previous Owner | Smith Regina | $117,500 | |
| Previous Owner | Smith Regina | $46,550 |
Source: Public Records
Tax History Compared to Growth
Tax History
| Year | Tax Paid | Tax Assessment Tax Assessment Total Assessment is a certain percentage of the fair market value that is determined by local assessors to be the total taxable value of land and additions on the property. | Land | Improvement |
|---|---|---|---|---|
| 2025 | $3,914 | $518,400 | $126,700 | $391,700 |
| 2024 | $6,802 | $370,700 | $83,200 | $287,500 |
| 2023 | $6,802 | $370,700 | $83,200 | $287,500 |
| 2022 | $5,632 | $370,700 | $83,200 | $287,500 |
| 2021 | $5,632 | $229,300 | $60,300 | $169,000 |
| 2020 | $5,632 | $229,300 | $60,300 | $169,000 |
| 2019 | $5,632 | $229,300 | $60,300 | $169,000 |
| 2018 | $5,043 | $157,800 | $46,600 | $111,200 |
| 2017 | $5,043 | $157,800 | $46,600 | $111,200 |
| 2016 | $5,043 | $157,800 | $46,600 | $111,200 |
| 2015 | $4,644 | $140,300 | $47,200 | $93,100 |
| 2014 | $4,735 | $140,300 | $47,200 | $93,100 |
| 2013 | $4,735 | $140,300 | $47,200 | $93,100 |
Source: Public Records
Map
Nearby Homes