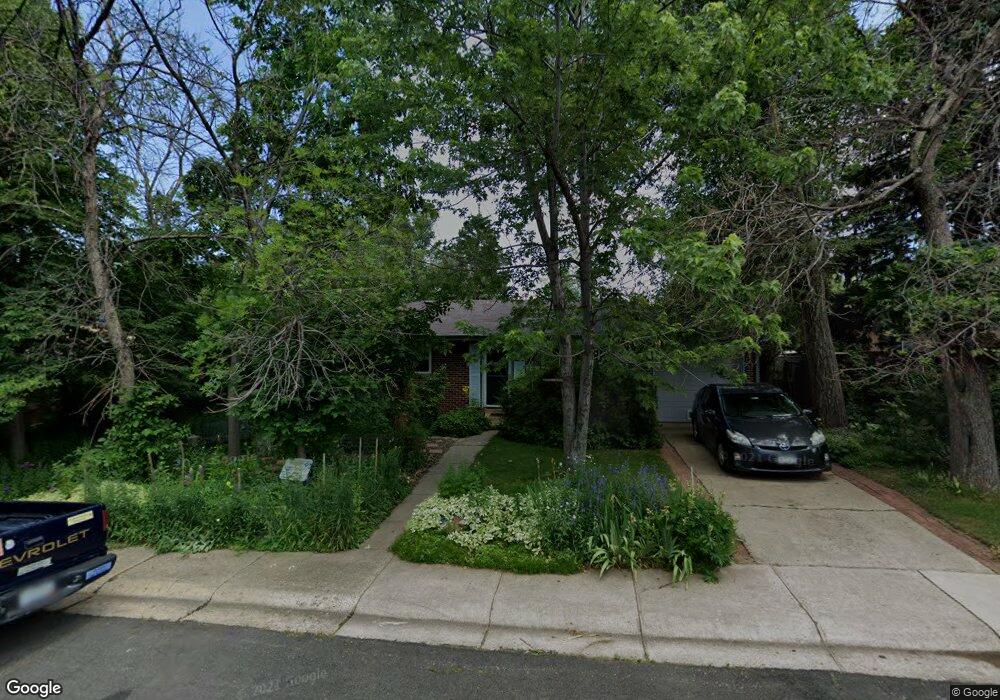
110 S 36th St Boulder, CO 80305
South Boulder NeighborhoodEstimated Value: $949,326 - $1,065,000
4
Beds
2
Baths
1,594
Sq Ft
$648/Sq Ft
Est. Value
About This Home
This home is located at 110 S 36th St, Boulder, CO 80305 and is currently estimated at $1,033,082, approximately $648 per square foot. 110 S 36th St is a home located in Boulder County with nearby schools including Creekside Elementary School, Manhattan Middle School of the Arts & Academics, and Fairview High School.
Ownership History
Date
Name
Owned For
Owner Type
Purchase Details
Closed on
Aug 18, 2008
Sold by
Shrewsbury Natalie L
Bought by
Hueftle Robert Alan
Current Estimated Value
Purchase Details
Closed on
Feb 22, 1988
Bought by
Hueftle Robert Alan
Purchase Details
Closed on
Dec 3, 1985
Bought by
Hueftle Robert Alan
Purchase Details
Closed on
Jun 3, 1981
Bought by
Hueftle Robert Alan
Purchase Details
Closed on
Sep 27, 1977
Bought by
Hueftle Robert Alan
Create a Home Valuation Report for This Property
The Home Valuation Report is an in-depth analysis detailing your home's value as well as a comparison with similar homes in the area
Home Values in the Area
Average Home Value in this Area
Purchase History
| Date | Buyer | Sale Price | Title Company |
|---|---|---|---|
| Hueftle Robert Alan | -- | None Available | |
| Hueftle Robert Alan | $78,900 | -- | |
| Hueftle Robert Alan | $74,000 | -- | |
| Hueftle Robert Alan | $69,000 | -- | |
| Hueftle Robert Alan | $44,500 | -- |
Source: Public Records
Tax History
| Year | Tax Paid | Tax Assessment Tax Assessment Total Assessment is a certain percentage of the fair market value that is determined by local assessors to be the total taxable value of land and additions on the property. | Land | Improvement |
|---|---|---|---|---|
| 2025 | $4,918 | $58,394 | $39,775 | $18,619 |
| 2024 | $4,918 | $58,394 | $39,775 | $18,619 |
| 2023 | $4,832 | $62,658 | $46,190 | $20,154 |
| 2022 | $4,307 | $53,327 | $34,479 | $18,848 |
| 2021 | $4,107 | $54,862 | $35,471 | $19,391 |
| 2020 | $3,886 | $51,795 | $28,958 | $22,837 |
| 2019 | $4,440 | $51,795 | $28,958 | $22,837 |
| 2018 | $4,049 | $46,706 | $26,352 | $20,354 |
| 2017 | $3,923 | $51,637 | $29,134 | $22,503 |
| 2016 | $3,532 | $40,803 | $17,671 | $23,132 |
| 2015 | $3,345 | $34,093 | $18,308 | $15,785 |
| 2014 | $2,867 | $34,093 | $18,308 | $15,785 |
Source: Public Records
Map
Nearby Homes
- 3805 Martin Dr
- 210 S 39th St
- 345 S 38th St
- 3000 Dartmouth Ave
- 450 S 41st St
- 2955 Stanford Ave
- 4453 Hamilton Ct
- 2585 Kohler Dr
- 2795 Vassar Dr
- 4595 Moorhead Ave
- 4521 Navajo Place
- 780 33rd St
- 725 S 45th St
- 4835 Moorhead Ave
- 770 36th St
- 2250 Bluebell Ave
- 805 29th St Unit 253
- 805 29th St Unit 157
- 805 29th St Unit 402
- 805 29th St Unit 404
Your Personal Tour Guide
Ask me questions while you tour the home.