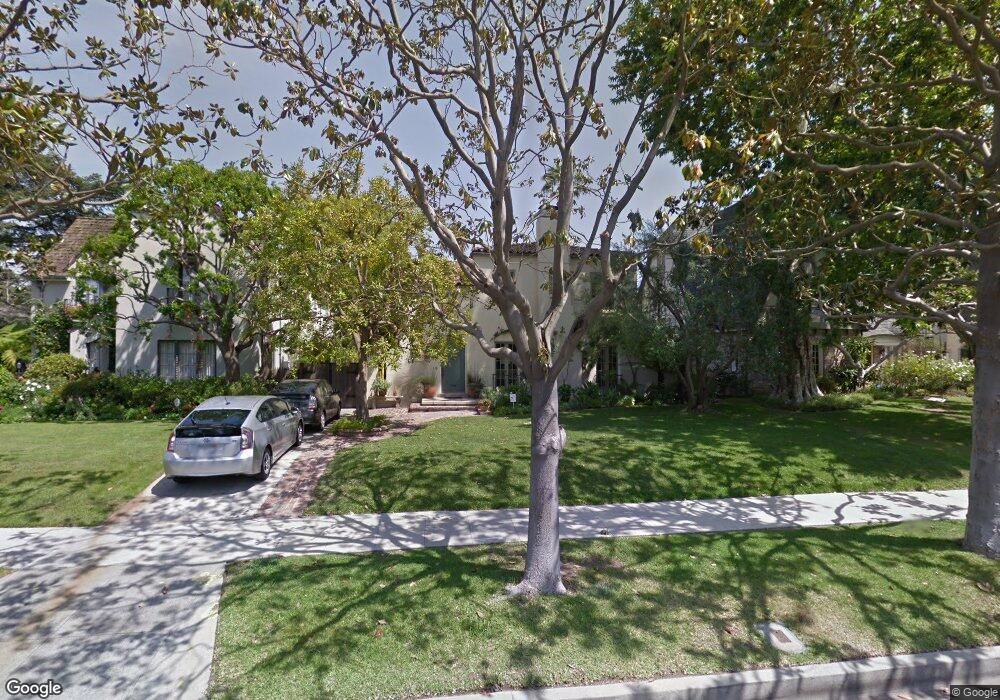
110 S Irving Blvd Los Angeles, CA 90004
Windsor Square NeighborhoodEstimated Value: $2,982,352 - $4,174,000
4
Beds
3
Baths
2,976
Sq Ft
$1,206/Sq Ft
Est. Value
About This Home
This home is located at 110 S Irving Blvd, Los Angeles, CA 90004 and is currently estimated at $3,589,838, approximately $1,206 per square foot. 110 S Irving Blvd is a home located in Los Angeles County with nearby schools including Third Street Elementary School, John Burroughs Middle School, and Fairfax High School.
Ownership History
Date
Name
Owned For
Owner Type
Purchase Details
Closed on
Jan 18, 2012
Sold by
Spetner Donald
Bought by
Spetner Donald and Goodman Laurie Rae
Current Estimated Value
Home Financials for this Owner
Home Financials are based on the most recent Mortgage that was taken out on this home.
Original Mortgage
$625,500
Outstanding Balance
$71,448
Interest Rate
3.88%
Mortgage Type
New Conventional
Estimated Equity
$3,518,390
Purchase Details
Closed on
Jan 8, 2001
Sold by
Biesty James T
Bought by
Spetner Donald and Goodman Laurie Rae
Home Financials for this Owner
Home Financials are based on the most recent Mortgage that was taken out on this home.
Original Mortgage
$850,000
Interest Rate
7.71%
Purchase Details
Closed on
Apr 10, 1998
Sold by
Sharp Rachelle G Trust
Bought by
Biesty James T and Biesty Julie A
Home Financials for this Owner
Home Financials are based on the most recent Mortgage that was taken out on this home.
Original Mortgage
$513,700
Interest Rate
7.06%
Create a Home Valuation Report for This Property
The Home Valuation Report is an in-depth analysis detailing your home's value as well as a comparison with similar homes in the area
Home Values in the Area
Average Home Value in this Area
Purchase History
| Date | Buyer | Sale Price | Title Company |
|---|---|---|---|
| Spetner Donald | -- | Accommodation | |
| Spetner Donald | -- | Fidelity National Title Co | |
| Spetner Donald | $1,151,000 | Equity Title | |
| Biesty James T | $685,000 | Investors Title Company |
Source: Public Records
Mortgage History
| Date | Status | Borrower | Loan Amount |
|---|---|---|---|
| Open | Spetner Donald | $625,500 | |
| Closed | Spetner Donald | $850,000 | |
| Previous Owner | Biesty James T | $513,700 |
Source: Public Records
Tax History Compared to Growth
Tax History
| Year | Tax Paid | Tax Assessment Tax Assessment Total Assessment is a certain percentage of the fair market value that is determined by local assessors to be the total taxable value of land and additions on the property. | Land | Improvement |
|---|---|---|---|---|
| 2025 | $20,880 | $1,734,365 | $1,386,294 | $348,071 |
| 2024 | $20,880 | $1,700,359 | $1,359,112 | $341,247 |
| 2023 | $20,474 | $1,667,019 | $1,332,463 | $334,556 |
| 2022 | $19,517 | $1,634,334 | $1,306,337 | $327,997 |
| 2021 | $19,269 | $1,602,289 | $1,280,723 | $321,566 |
| 2019 | $18,687 | $1,554,766 | $1,242,737 | $312,029 |
| 2018 | $18,611 | $1,524,281 | $1,218,370 | $305,911 |
| 2016 | $17,792 | $1,465,093 | $1,171,060 | $294,033 |
| 2015 | $17,524 | $1,443,087 | $1,153,470 | $289,617 |
| 2014 | $17,579 | $1,414,820 | $1,130,876 | $283,944 |
Source: Public Records
Map
Nearby Homes
- 111 S Van Ness Ave
- 200 Lorraine Blvd
- 218 Lorraine Blvd
- 236 S Irving Blvd
- 226 N Irving Blvd
- 253 N Irving Blvd
- 257 S Van Ness Ave
- 268 S Norton Ave
- 312 N Bronson Ave
- 234 N Ridgewood Place
- 239 S Gramercy Place
- 140 S Gramercy Place Unit 1
- 326 Westminster Ave Unit 201
- 362 N Norton Ave
- 161 S St Andrews Place
- 221 S St Andrews Place
- 333 S Wilton Place Unit 2
- 326 N Gower St
- 4651 Council St
- 408 N Beachwood Dr
- 114 S Irving Blvd
- 100 S Irving Blvd
- 120 S Irving Blvd
- 4910 W 1st St
- 111 S Norton Ave
- 101 S Norton Ave
- 117 S Norton Ave
- 126 S Irving Blvd
- 100 N Irving Blvd
- 123 S Norton Ave
- 107 S Irving Blvd
- 115 S Irving Blvd
- 4907 W 1st St
- 132 S Irving Blvd
- 129 S Norton Ave
- 103 N Norton Ave
- 103 N Norton Ave
- 101 N Irving Blvd
- 129 S Irving Blvd
- 135 S Norton Ave