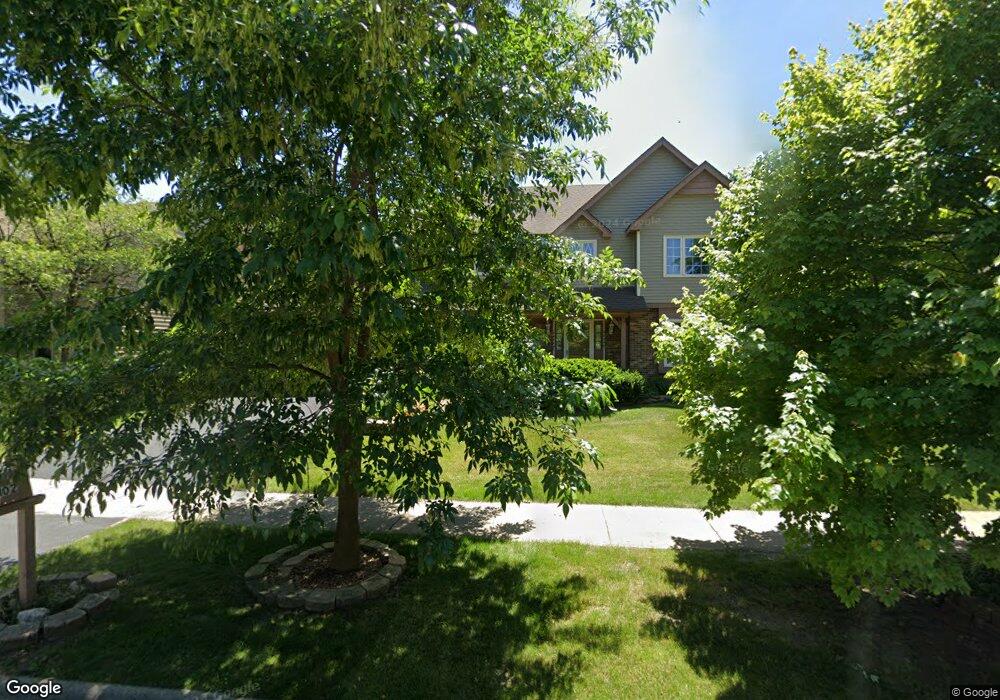
1102 Augustana Dr Unit 3B Naperville, IL 60565
Walnut Ridge NeighborhoodEstimated Value: $807,000 - $849,779
4
Beds
4
Baths
3,378
Sq Ft
$245/Sq Ft
Est. Value
About This Home
This home is located at 1102 Augustana Dr Unit 3B, Naperville, IL 60565 and is currently estimated at $828,195, approximately $245 per square foot. 1102 Augustana Dr Unit 3B is a home located in Will County with nearby schools including River Woods Elementary School, Madison Jr High School, and Naperville Central High School.
Ownership History
Date
Name
Owned For
Owner Type
Purchase Details
Closed on
Mar 3, 2011
Sold by
Manuel Rosalie C
Bought by
Dullur Abhijit and Chakravarthi Srimani
Current Estimated Value
Home Financials for this Owner
Home Financials are based on the most recent Mortgage that was taken out on this home.
Original Mortgage
$324,720
Outstanding Balance
$225,206
Interest Rate
4.99%
Mortgage Type
New Conventional
Estimated Equity
$602,989
Create a Home Valuation Report for This Property
The Home Valuation Report is an in-depth analysis detailing your home's value as well as a comparison with similar homes in the area
Home Values in the Area
Average Home Value in this Area
Purchase History
| Date | Buyer | Sale Price | Title Company |
|---|---|---|---|
| Dullur Abhijit | $409,000 | National Title Solutions Inc |
Source: Public Records
Mortgage History
| Date | Status | Borrower | Loan Amount |
|---|---|---|---|
| Open | Dullur Abhijit | $324,720 |
Source: Public Records
Tax History Compared to Growth
Tax History
| Year | Tax Paid | Tax Assessment Tax Assessment Total Assessment is a certain percentage of the fair market value that is determined by local assessors to be the total taxable value of land and additions on the property. | Land | Improvement |
|---|---|---|---|---|
| 2024 | $14,936 | $239,494 | $49,815 | $189,679 |
| 2023 | $14,936 | $215,489 | $44,822 | $170,667 |
| 2022 | $12,951 | $194,274 | $40,409 | $153,865 |
| 2021 | $12,090 | $181,649 | $37,783 | $143,866 |
| 2020 | $12,269 | $184,922 | $38,464 | $146,458 |
| 2019 | $11,852 | $176,116 | $36,632 | $139,484 |
| 2018 | $11,314 | $168,564 | $35,061 | $133,503 |
| 2017 | $10,896 | $159,776 | $33,233 | $126,543 |
| 2016 | $11,102 | $160,100 | $33,300 | $126,800 |
| 2015 | $10,166 | $153,500 | $31,900 | $121,600 |
| 2014 | $10,166 | $153,500 | $31,900 | $121,600 |
| 2013 | $10,166 | $149,100 | $31,000 | $118,100 |
Source: Public Records
Map
Nearby Homes
- 2230 Keim Rd Unit 3B
- 2248 Aster Ct
- 816 Spindletree Ave
- 1120 Colgate Ct
- 805 Potomac Ave
- 743 Arlington Ave
- 705 Potomac Ave
- 25 W 500 Royce Rd
- 710 Alexandria Dr
- 569 Boardman Cir
- 541 Boardman Cir
- 707 Crestview Dr
- 336 Brooklea Ct
- 1704 Kenyon Dr
- 1340 Auburn Ave
- 517 Sheffield Rd
- 627 Nanak Ct
- 342 Dilorenzo Dr
- 2280 Barth Dr
- 1323 Auburn Ave
- 1098 Augustana Dr
- 1106 Augustana Dr
- 2125 University Dr
- 2129 University Dr
- 1094 Augustana Dr
- 2117 University Dr
- 2218 Wooster Ct
- 2133 University Dr
- 1090 Augustana Dr
- 2122 University Dr
- 2124 University Dr
- 2113 University Dr
- 2137 University Dr
- 2126 University Dr Unit 38
- 2214 Wooster Ct
- 2118 University Dr
- 2217 Wooster Ct
- 1086 Augustana Dr
- 2128 University Dr
- 2298 Xavier Ct