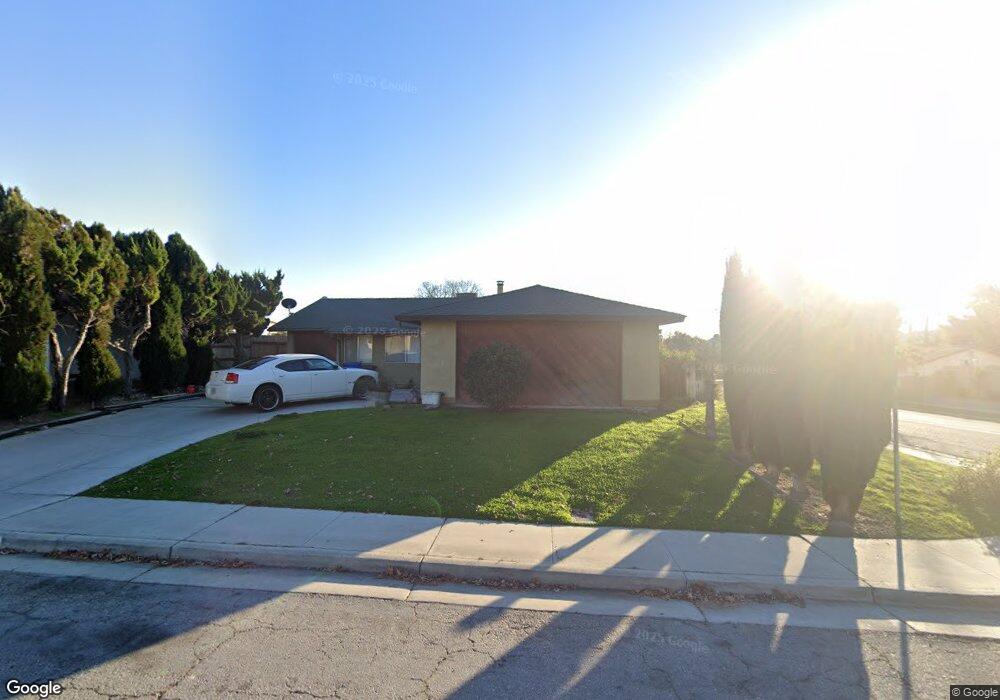
1102 Dorothy St Paso Robles, CA 93446
Estimated Value: $523,248 - $619,000
3
Beds
2
Baths
1,200
Sq Ft
$484/Sq Ft
Est. Value
About This Home
This home is located at 1102 Dorothy St, Paso Robles, CA 93446 and is currently estimated at $580,812, approximately $484 per square foot. 1102 Dorothy St is a home located in San Luis Obispo County with nearby schools including Winifred Pifer Elementary School, Daniel Lewis Middle School, and Paso Robles High School.
Ownership History
Date
Name
Owned For
Owner Type
Purchase Details
Closed on
Mar 20, 2014
Sold by
Sorensen Neil C and Sorensen Karen L
Bought by
Sorensen Revoc Neil C and Sorensen Revoc Karen L
Current Estimated Value
Purchase Details
Closed on
Oct 6, 1997
Sold by
Va
Bought by
Sorensen Neil C and Sorensen Karen L
Home Financials for this Owner
Home Financials are based on the most recent Mortgage that was taken out on this home.
Original Mortgage
$79,200
Outstanding Balance
$12,769
Interest Rate
7.49%
Mortgage Type
VA
Estimated Equity
$568,043
Purchase Details
Closed on
Dec 5, 1996
Sold by
Devine Yuk Mei and Yuk Mei Devine Trust
Bought by
Sorensen Neil C and Sorensen Karen L
Home Financials for this Owner
Home Financials are based on the most recent Mortgage that was taken out on this home.
Original Mortgage
$50,000
Interest Rate
7.67%
Mortgage Type
Seller Take Back
Create a Home Valuation Report for This Property
The Home Valuation Report is an in-depth analysis detailing your home's value as well as a comparison with similar homes in the area
Purchase History
| Date | Buyer | Sale Price | Title Company |
|---|---|---|---|
| Sorensen Revoc Neil C | -- | None Available | |
| Sorensen Neil C | $88,000 | First American Title Ins Co | |
| Sorensen Neil C | $18,000 | First American Title Ins Co |
Source: Public Records
Mortgage History
| Date | Status | Borrower | Loan Amount |
|---|---|---|---|
| Open | Sorensen Neil C | $79,200 | |
| Previous Owner | Sorensen Neil C | $50,000 |
Source: Public Records
Tax History
| Year | Tax Paid | Tax Assessment Tax Assessment Total Assessment is a certain percentage of the fair market value that is determined by local assessors to be the total taxable value of land and additions on the property. | Land | Improvement |
|---|---|---|---|---|
| 2025 | $1,636 | $150,082 | $60,025 | $90,057 |
| 2024 | $1,609 | $147,141 | $58,849 | $88,292 |
| 2023 | $1,609 | $144,257 | $57,696 | $86,561 |
| 2022 | $1,585 | $141,429 | $56,565 | $84,864 |
| 2021 | $1,558 | $138,656 | $55,456 | $83,200 |
| 2020 | $1,537 | $137,235 | $54,888 | $82,347 |
| 2019 | $1,515 | $134,545 | $53,812 | $80,733 |
| 2018 | $1,495 | $131,907 | $52,757 | $79,150 |
| 2017 | $1,405 | $129,322 | $51,723 | $77,599 |
| 2016 | $1,378 | $126,787 | $50,709 | $76,078 |
| 2015 | $1,373 | $124,884 | $49,948 | $74,936 |
| 2014 | $1,249 | $122,439 | $48,970 | $73,469 |
Source: Public Records
Map
Nearby Homes
- 1107 Patricia Ln
- 843 Hacienda Cir
- 1036 Samantha Dr
- 845 Creston Rd
- 225 Lark Dr
- 291 Quail Summit
- 827 Marlbank Place
- 301 Oak Meadow Ln
- 1020 Par Ave
- 940 Austin Ct
- 4 Dove Ct
- 507 Grand Canyon Dr
- 509 Grand Canyon Dr
- 711 Knight Ct
- 629 Trigo Ln
- 334 Partridge Ave
- 610 Tucker Ave
- 621 Jackson Dr
- 268 Camino Lobo
- 616 Jackson Dr
- 1108 Dorothy St
- 1105 Linda Cir
- 1107 Linda Cir
- 1118 Dorothy St
- 1090 Dorothy Ct
- 1095 Sylvia Cir
- 1103 Dorothy St
- 1125 Linda Cir
- 1109 Dorothy St
- 1130 Dorothy St
- 1082 Dorothy Ct
- 1091 Dorothy Ct
- 1123 Dorothy St
- 1091 Sylvia Cir
- 1140 Dorothy St
- 1104 Linda Cir
- 1131 Linda Cir
- 1106 Linda Cir
- 1074 Dorothy Ct
- 1083 Dorothy Ct
Your Personal Tour Guide
Ask me questions while you tour the home.