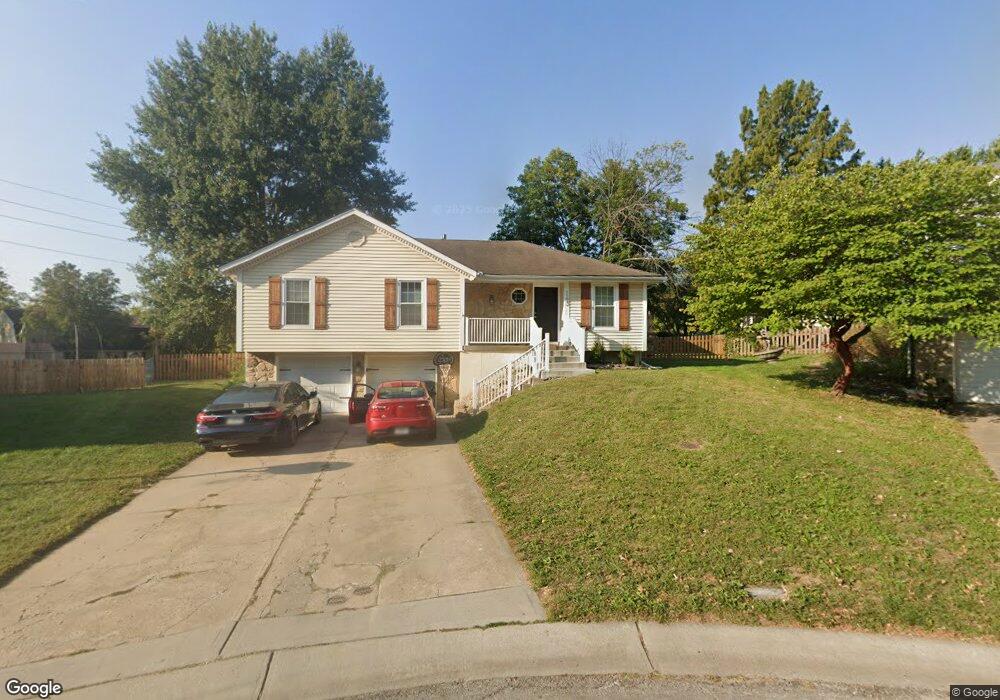
1102 NE Richardson Place Lees Summit, MO 64086
Estimated Value: $295,172 - $315,000
3
Beds
2
Baths
1,220
Sq Ft
$249/Sq Ft
Est. Value
About This Home
This home is located at 1102 NE Richardson Place, Lees Summit, MO 64086 and is currently estimated at $303,293, approximately $248 per square foot. 1102 NE Richardson Place is a home located in Jackson County with nearby schools including Underwood Elementary School, Bernard C. Campbell Middle School, and Lee's Summit North High School.
Ownership History
Date
Name
Owned For
Owner Type
Purchase Details
Closed on
Feb 17, 2022
Sold by
Thompson and Kaylin
Bought by
Rs Rental Iii-A Llc
Current Estimated Value
Purchase Details
Closed on
Jun 15, 2020
Sold by
Carignan Robert E and Carignan Ashley Hobbs
Bought by
Thompson Travis and Thompson Kaylin
Home Financials for this Owner
Home Financials are based on the most recent Mortgage that was taken out on this home.
Original Mortgage
$144,243
Interest Rate
3.2%
Mortgage Type
VA
Purchase Details
Closed on
Oct 25, 2006
Sold by
Rix Sandra S
Bought by
Carignan Robert E
Home Financials for this Owner
Home Financials are based on the most recent Mortgage that was taken out on this home.
Original Mortgage
$151,900
Interest Rate
6.41%
Mortgage Type
Purchase Money Mortgage
Purchase Details
Closed on
May 11, 2001
Sold by
Rix Timothy Charles
Bought by
Rix Sandra S
Create a Home Valuation Report for This Property
The Home Valuation Report is an in-depth analysis detailing your home's value as well as a comparison with similar homes in the area
Home Values in the Area
Average Home Value in this Area
Purchase History
| Date | Buyer | Sale Price | Title Company |
|---|---|---|---|
| Rs Rental Iii-A Llc | -- | Coffelt Land Title | |
| Rs Rental Iii-A Llc | -- | Coffelt Land Title | |
| Rs Rental Iii-A Llc | -- | Coffelt Land Title | |
| Thompson Travis | -- | Mccaffree Short Title | |
| Carignan Robert E | -- | Metro One Title | |
| Rix Sandra S | -- | Realty Title Company |
Source: Public Records
Mortgage History
| Date | Status | Borrower | Loan Amount |
|---|---|---|---|
| Previous Owner | Thompson Travis | $144,243 | |
| Previous Owner | Carignan Robert E | $151,900 |
Source: Public Records
Tax History Compared to Growth
Tax History
| Year | Tax Paid | Tax Assessment Tax Assessment Total Assessment is a certain percentage of the fair market value that is determined by local assessors to be the total taxable value of land and additions on the property. | Land | Improvement |
|---|---|---|---|---|
| 2025 | $3,151 | $39,199 | $7,074 | $32,125 |
| 2024 | $3,151 | $40,481 | $6,680 | $33,801 |
| 2023 | $2,902 | $40,481 | $6,302 | $34,179 |
| 2022 | $2,393 | $29,640 | $5,843 | $23,797 |
| 2021 | $2,442 | $29,640 | $5,843 | $23,797 |
| 2020 | $2,353 | $28,276 | $5,843 | $22,433 |
| 2019 | $2,288 | $28,276 | $5,843 | $22,433 |
| 2018 | $986,637 | $26,971 | $3,944 | $23,027 |
| 2017 | $2,352 | $26,971 | $3,944 | $23,027 |
| 2016 | $2,317 | $26,296 | $4,484 | $21,812 |
| 2014 | $2,279 | $25,359 | $4,186 | $21,173 |
Source: Public Records
Map
Nearby Homes
- 1121 NE Ridgeview Dr
- 732 NE Deerbrook St
- 1220 NE Hendrix Dr
- 1345 NE Foxwood Dr
- 807 NE Balboa St
- 1404 NE Oakwood Dr
- 705 NE Balboa St
- 27008 E Olive Dr
- 27104 E Cedar Grove Dr
- 1408 NE Whitestone Dr
- 653 NE Reed Crossing
- 809 NE Mulberry St
- 1029 NE Trailwood St
- 1300 NE Browning Ln
- 801 NE Bryant Dr
- 1117 NE Clubhouse Ln
- 1424 NE Stonewood Dr
- 1637 NE Westwind Dr
- 800 NE Mulberry St
- 1425 NE Stonewood Dr
- 1100 NE Richardson Place
- 1106 NE Richardson Place
- 1103 NE Richardson Place
- 1110 NE Richardson Place
- 1107 NE Richardson Place
- 1111 NE Richardson Place
- 1101 NE Westwind Dr
- 1105 NE Westwind Dr
- 1114 NE Richardson Place
- 1109 NE Westwind Dr
- 1025 NE Scruggs Rd
- 1115 NE Richardson Place
- 1113 NE Westwind Dr
- 1118 NE Richardson Place
- 1104 NE Banner Dr
- 1100 NE Westwind Dr
- 1119 NE Richardson Place
- 1104 NE Westwind Dr
- 1108 NE Banner Dr
- 1018 NE Banner St