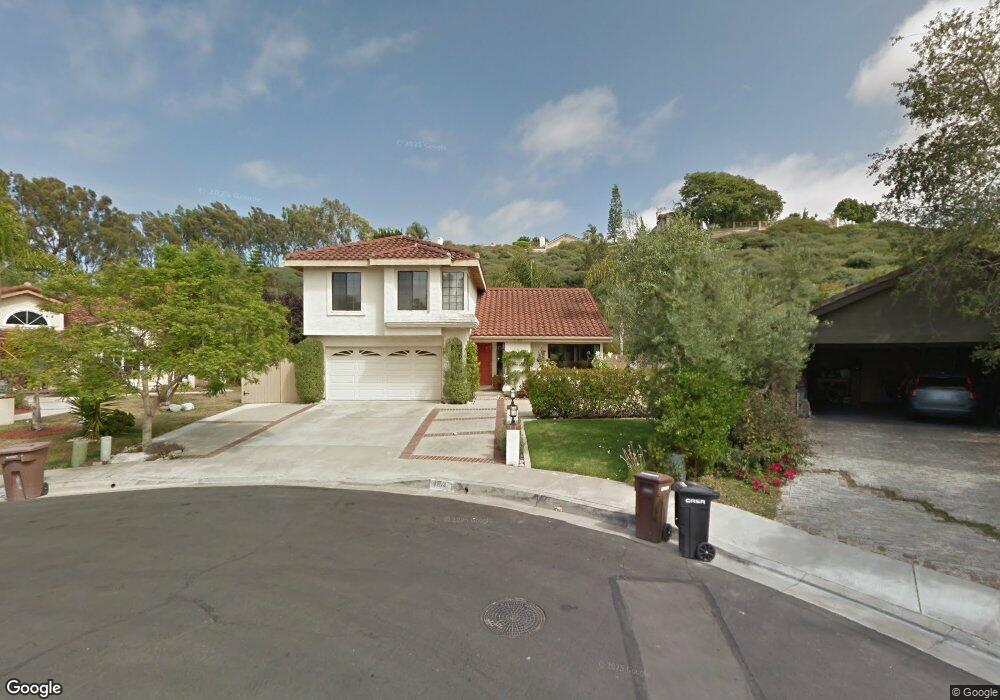
1103 Otero San Clemente, CA 92673
Forster Ranch NeighborhoodEstimated Value: $1,790,358 - $2,297,000
4
Beds
3
Baths
2,326
Sq Ft
$848/Sq Ft
Est. Value
About This Home
This home is located at 1103 Otero, San Clemente, CA 92673 and is currently estimated at $1,971,340, approximately $847 per square foot. 1103 Otero is a home located in Orange County with nearby schools including Truman Benedict Elementary School, Bernice Ayer Middle School, and San Clemente High School.
Ownership History
Date
Name
Owned For
Owner Type
Purchase Details
Closed on
Nov 3, 2012
Sold by
Cowell David M and Cowell Colleen A
Bought by
Cowell David M and Cowell Colleen A
Current Estimated Value
Home Financials for this Owner
Home Financials are based on the most recent Mortgage that was taken out on this home.
Original Mortgage
$135,000
Interest Rate
3.36%
Mortgage Type
New Conventional
Purchase Details
Closed on
Jun 22, 2006
Sold by
Cowell David M and Cowell Colleen A
Bought by
Cowell David M and Cowell Colleen A
Purchase Details
Closed on
Nov 11, 1999
Sold by
David Collins and David Sue Collins
Bought by
Cowell David M and Cowell Colleen A
Home Financials for this Owner
Home Financials are based on the most recent Mortgage that was taken out on this home.
Original Mortgage
$330,400
Interest Rate
7.96%
Create a Home Valuation Report for This Property
The Home Valuation Report is an in-depth analysis detailing your home's value as well as a comparison with similar homes in the area
Home Values in the Area
Average Home Value in this Area
Purchase History
| Date | Buyer | Sale Price | Title Company |
|---|---|---|---|
| Cowell David M | -- | Accommodation | |
| Cowell David M | -- | Lawyers Title | |
| Cowell David M | -- | None Available | |
| Cowell David M | $413,000 | Lawyers Title Company |
Source: Public Records
Mortgage History
| Date | Status | Borrower | Loan Amount |
|---|---|---|---|
| Previous Owner | Cowell David M | $135,000 | |
| Previous Owner | Cowell David M | $330,400 |
Source: Public Records
Tax History Compared to Growth
Tax History
| Year | Tax Paid | Tax Assessment Tax Assessment Total Assessment is a certain percentage of the fair market value that is determined by local assessors to be the total taxable value of land and additions on the property. | Land | Improvement |
|---|---|---|---|---|
| 2025 | $6,487 | $659,100 | $400,593 | $258,507 |
| 2024 | $6,487 | $646,177 | $392,738 | $253,439 |
| 2023 | $6,349 | $633,507 | $385,037 | $248,470 |
| 2022 | $6,227 | $621,086 | $377,487 | $243,599 |
| 2021 | $6,105 | $608,908 | $370,085 | $238,823 |
| 2020 | $6,044 | $602,665 | $366,290 | $236,375 |
| 2019 | $5,924 | $590,849 | $359,108 | $231,741 |
| 2018 | $5,809 | $579,264 | $352,066 | $227,198 |
| 2017 | $5,694 | $567,906 | $345,162 | $222,744 |
| 2016 | $5,507 | $549,249 | $338,395 | $210,854 |
| 2015 | $5,423 | $540,999 | $333,312 | $207,687 |
| 2014 | $5,318 | $530,402 | $326,783 | $203,619 |
Source: Public Records
Map
Nearby Homes
- 2846 Calle Esteban
- 1205 Cerca
- 1200 Cerca
- 2878 Riachuelo
- 145 Mira Del Norte
- 2933 Via Blanco
- 101 Mira Adelante Unit 101
- 53 Mira Las Olas
- 6 Avenida Fortuna
- 41 Mira Las Olas
- 703 Calle Cumbre
- 2205 Via Iris
- 110 Del Cabo Unit C34
- 14 Tesoro
- 1204 Vista Jardin
- 1405 Manera Ventosa
- 4 Via Del Tesoro
- 5417 Camino Mojado
- 1302 Cadena
- 2413 Camino Oleada