C
Landlord's Agent in 2020
Craig Broeking
Craig Broeking
1 in this area
13 Total Sales


Estimated Value: $282,000 - $302,000
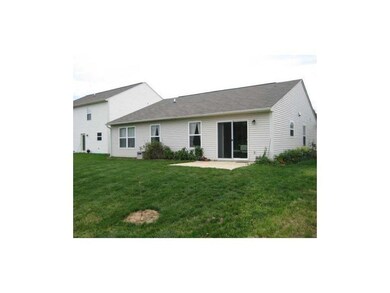
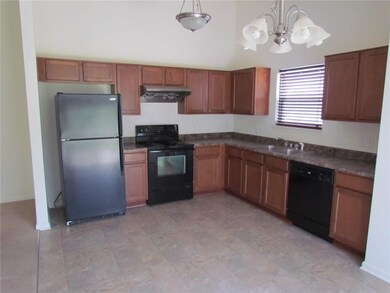
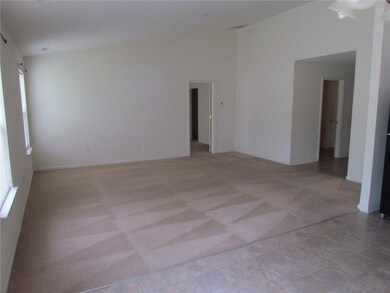
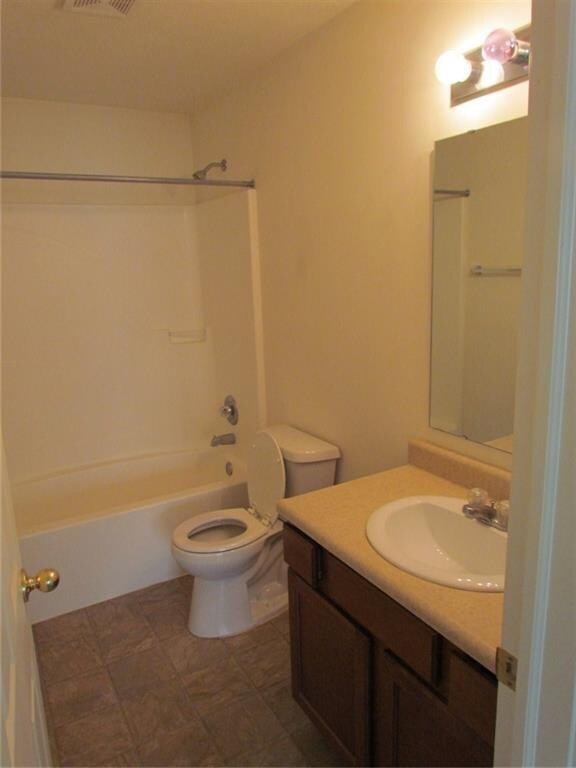
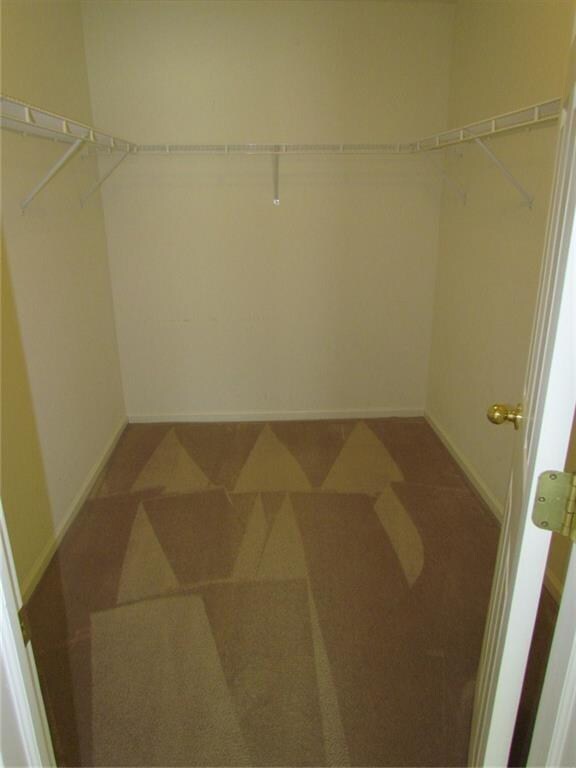
#BR, 2Ba Great Room ranch with split floor plan. 2-car attached garage w/opener & keyless remote. All appliances included. Neutral decor. Convenient location. NO smoking. Pets w/approval and additional pet deposit.
Last Agent to Rent the Property
Craig Broeking License #RB14028015 Listed on: 05/10/2020
Last Renter's Agent
Brian Livingston
F.C. Tucker Company

| Date | Buyer | Sale Price | Title Company |
|---|---|---|---|
| Yang Jianlan | -- | Fat | |
| Westport Homes Inc | -- | None Available | |
| Beazer Homes Indiana Llp | -- | None Available |
| Date | Status | Borrower | Loan Amount |
|---|---|---|---|
| Open | Yang Jianlan | $111,726 |
| Date | Event | Price | List to Sale | Price per Sq Ft |
|---|---|---|---|---|
| 06/01/2020 06/01/20 | Rented | $1,495 | 0.0% | -- |
| 05/19/2020 05/19/20 | Under Contract | -- | -- | -- |
| 05/10/2020 05/10/20 | For Rent | $1,495 | +7.2% | -- |
| 09/01/2018 09/01/18 | Rented | $1,395 | 0.0% | -- |
| 08/21/2018 08/21/18 | Under Contract | -- | -- | -- |
| 07/30/2018 07/30/18 | For Rent | $1,395 | +11.6% | -- |
| 11/11/2016 11/11/16 | Rented | $1,250 | +2.0% | -- |
| 10/17/2016 10/17/16 | Price Changed | $1,225 | 0.0% | $1 / Sq Ft |
| 10/17/2016 10/17/16 | For Rent | $1,225 | -3.9% | -- |
| 10/07/2016 10/07/16 | Off Market | $1,275 | -- | -- |
| 08/17/2016 08/17/16 | Price Changed | $1,275 | -1.5% | $1 / Sq Ft |
| 07/16/2016 07/16/16 | Price Changed | $1,295 | -4.1% | $1 / Sq Ft |
| 07/07/2016 07/07/16 | For Rent | $1,350 | +12.5% | -- |
| 02/23/2015 02/23/15 | Rented | $1,200 | -7.3% | -- |
| 02/03/2015 02/03/15 | Under Contract | -- | -- | -- |
| 10/29/2014 10/29/14 | For Rent | $1,295 | +8.4% | -- |
| 11/23/2012 11/23/12 | Rented | $1,195 | 0.0% | -- |
| 10/17/2012 10/17/12 | Under Contract | -- | -- | -- |
| 10/02/2012 10/02/12 | For Rent | $1,195 | -- | -- |
| Year | Tax Paid | Tax Assessment Tax Assessment Total Assessment is a certain percentage of the fair market value that is determined by local assessors to be the total taxable value of land and additions on the property. | Land | Improvement |
|---|---|---|---|---|
| 2024 | $4,971 | $241,600 | $47,400 | $194,200 |
| 2023 | $4,971 | $229,400 | $47,400 | $182,000 |
| 2022 | $4,510 | $204,500 | $47,400 | $157,100 |
| 2021 | $3,991 | $178,100 | $47,400 | $130,700 |
| 2020 | $3,839 | $168,900 | $47,400 | $121,500 |
| 2019 | $3,666 | $160,600 | $32,800 | $127,800 |
| 2018 | $3,425 | $150,100 | $32,800 | $117,300 |
| 2017 | $3,141 | $139,300 | $32,800 | $106,500 |
| 2016 | $2,956 | $132,000 | $32,800 | $99,200 |
| 2014 | $2,691 | $129,100 | $32,800 | $96,300 |
| 2013 | $2,691 | $127,300 | $32,800 | $94,500 |
C
Landlord's Agent in 2020
Craig Broeking
Craig Broeking
1 in this area
13 Total Sales
B
Tenant's Agent in 2020
Brian Livingston
F.C. Tucker Company
J
Buyer's Agent in 2018
Jason Kammeyer
F.C. Tucker Company
Source: MIBOR Broker Listing Cooperative®
MLS Number: MBR21709335
APN: 29-11-33-018-011.000-020
Disclaimer: Certain information contained herein is derived from information provided by parties other than Homes.com. All information provided is deemed reliable, but is not guaranteed to be accurate and should be independently verified.
![]() Based on information submitted to the MLS GRID. All data is obtained from various sources and may not have been verified by broker or MLS GRID. Supplied Open House Information is subject to change without notice. All information should be independently reviewed and verified for accuracy. Properties may or may not be listed by the office/agent presenting the information. Some IDX listings have been excluded from this website.
Based on information submitted to the MLS GRID. All data is obtained from various sources and may not have been verified by broker or MLS GRID. Supplied Open House Information is subject to change without notice. All information should be independently reviewed and verified for accuracy. Properties may or may not be listed by the office/agent presenting the information. Some IDX listings have been excluded from this website.