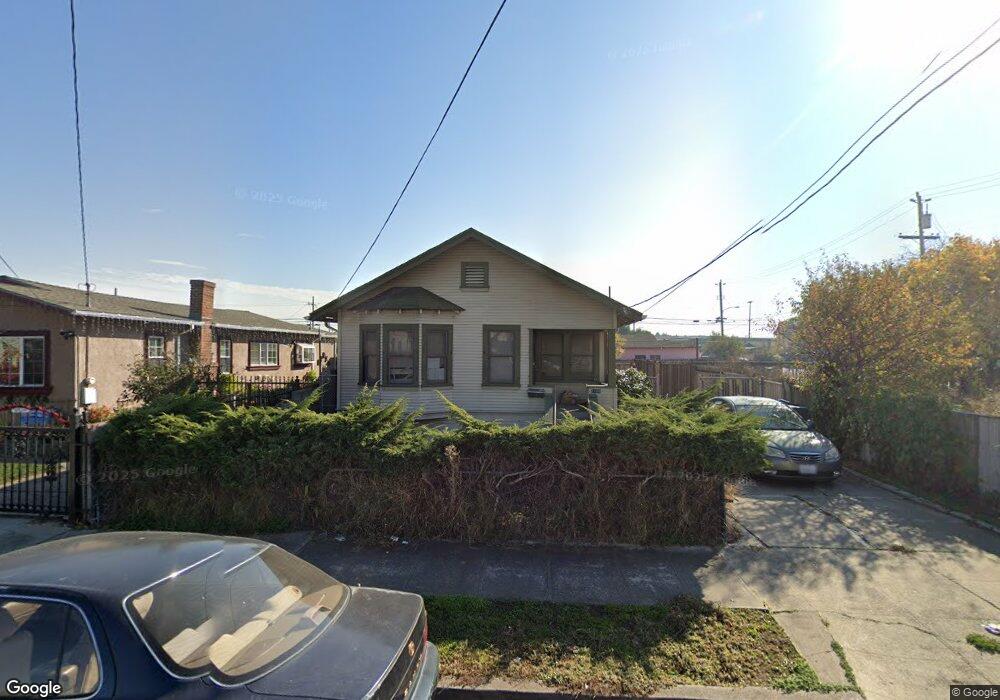
1106 75th Ave Oakland, CA 94621
Fitchburg NeighborhoodEstimated Value: $393,387 - $446,000
2
Beds
1
Bath
892
Sq Ft
$479/Sq Ft
Est. Value
About This Home
This home is located at 1106 75th Ave, Oakland, CA 94621 and is currently estimated at $427,129, approximately $478 per square foot. 1106 75th Ave is a home located in Alameda County with nearby schools including Futures & CUES at Lockwood, Greenleaf TK-8, and Coliseum College Prep Academy.
Ownership History
Date
Name
Owned For
Owner Type
Purchase Details
Closed on
Jan 15, 2016
Sold by
Wells Fargo Bank Na
Bought by
Sanchez Tomas
Current Estimated Value
Purchase Details
Closed on
Jun 25, 2014
Sold by
Pwe Property Investment Llc
Bought by
75Th Avenue Trust
Purchase Details
Closed on
Feb 13, 2008
Sold by
Pwe Property Investment Llc
Bought by
Wachovia Mortgage Fsb and World Savings Bank Fsb
Purchase Details
Closed on
Mar 28, 2005
Sold by
Edwards Phillip W
Bought by
Pwe Property Investment Llc
Purchase Details
Closed on
Jun 2, 2000
Sold by
Edwards Phillip
Bought by
Edwards Phillip and Edwards Phillip W
Create a Home Valuation Report for This Property
The Home Valuation Report is an in-depth analysis detailing your home's value as well as a comparison with similar homes in the area
Home Values in the Area
Average Home Value in this Area
Purchase History
| Date | Buyer | Sale Price | Title Company |
|---|---|---|---|
| Sanchez Tomas | $170,000 | Orange Coast Title Company | |
| 75Th Avenue Trust | -- | None Available | |
| Wachovia Mortgage Fsb | $184,418 | First American Title | |
| Pwe Property Investment Llc | -- | -- | |
| Edwards Phillip | -- | -- |
Source: Public Records
Tax History Compared to Growth
Tax History
| Year | Tax Paid | Tax Assessment Tax Assessment Total Assessment is a certain percentage of the fair market value that is determined by local assessors to be the total taxable value of land and additions on the property. | Land | Improvement |
|---|---|---|---|---|
| 2025 | $3,604 | $142,051 | $42,615 | $99,436 |
| 2024 | $3,604 | $139,267 | $41,780 | $97,487 |
| 2023 | $3,671 | $136,537 | $40,961 | $95,576 |
| 2022 | $3,511 | $133,860 | $40,158 | $93,702 |
| 2021 | $3,219 | $131,234 | $39,370 | $91,864 |
| 2020 | $3,182 | $129,890 | $38,967 | $90,923 |
| 2019 | $2,976 | $127,343 | $38,203 | $89,140 |
| 2018 | $2,918 | $124,847 | $37,454 | $87,393 |
| 2017 | $2,775 | $122,400 | $36,720 | $85,680 |
| 2016 | $3,390 | $167,515 | $50,254 | $117,261 |
| 2015 | $3,223 | $165,000 | $49,500 | $115,500 |
| 2014 | $2,529 | $71,041 | $36,231 | $34,810 |
Source: Public Records
Map
Nearby Homes