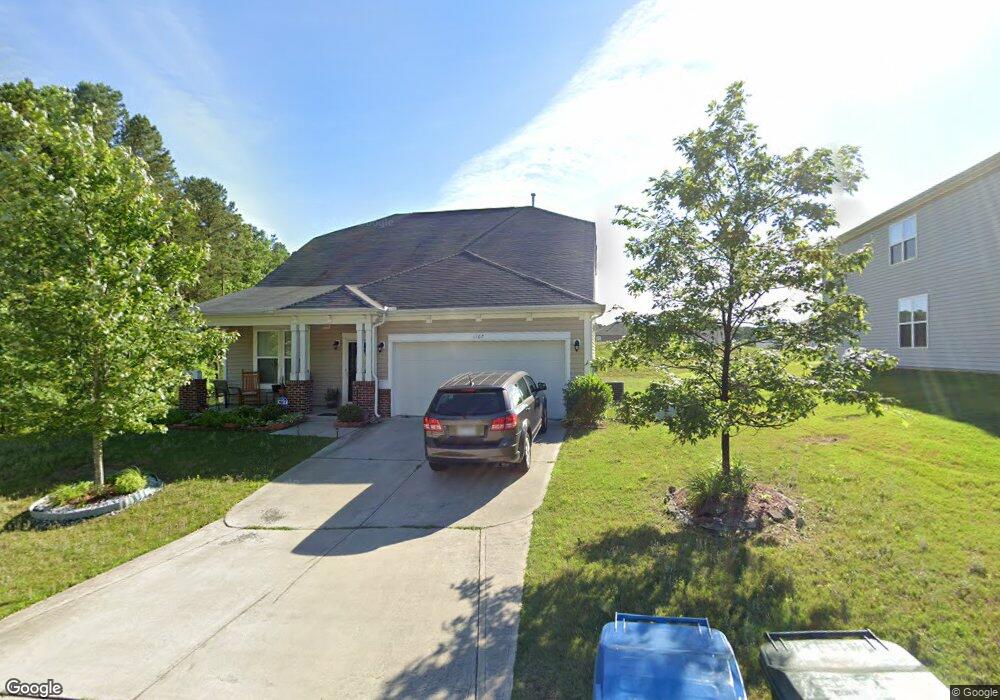
1107 Red Crest Ln Durham, NC 27704
Eastern Durham NeighborhoodEstimated Value: $312,000 - $385,000
3
Beds
3
Baths
1,740
Sq Ft
$202/Sq Ft
Est. Value
About This Home
This home is located at 1107 Red Crest Ln, Durham, NC 27704 and is currently estimated at $351,687, approximately $202 per square foot. 1107 Red Crest Ln is a home located in Durham County with nearby schools including Glenn Elementary, John W Neal Middle School, and Southern School of Energy & Sustainability.
Ownership History
Date
Name
Owned For
Owner Type
Purchase Details
Closed on
Jun 29, 2010
Sold by
Beazer Homes Corp
Bought by
Patterson Joyce V and Patterson Henry
Current Estimated Value
Home Financials for this Owner
Home Financials are based on the most recent Mortgage that was taken out on this home.
Original Mortgage
$169,866
Outstanding Balance
$111,737
Interest Rate
4.83%
Mortgage Type
FHA
Estimated Equity
$239,950
Create a Home Valuation Report for This Property
The Home Valuation Report is an in-depth analysis detailing your home's value as well as a comparison with similar homes in the area
Home Values in the Area
Average Home Value in this Area
Purchase History
| Date | Buyer | Sale Price | Title Company |
|---|---|---|---|
| Patterson Joyce V | $173,000 | None Available |
Source: Public Records
Mortgage History
| Date | Status | Borrower | Loan Amount |
|---|---|---|---|
| Open | Patterson Joyce V | $169,866 |
Source: Public Records
Tax History
| Year | Tax Paid | Tax Assessment Tax Assessment Total Assessment is a certain percentage of the fair market value that is determined by local assessors to be the total taxable value of land and additions on the property. | Land | Improvement |
|---|---|---|---|---|
| 2025 | $3,629 | $366,118 | $75,625 | $290,493 |
| 2024 | $2,793 | $200,193 | $36,390 | $163,803 |
| 2023 | $2,622 | $200,193 | $36,390 | $163,803 |
| 2022 | $2,562 | $200,193 | $36,390 | $163,803 |
| 2021 | $2,550 | $200,193 | $36,390 | $163,803 |
| 2020 | $2,490 | $200,193 | $36,390 | $163,803 |
| 2019 | $2,490 | $200,193 | $36,390 | $163,803 |
| 2018 | $2,322 | $171,158 | $36,390 | $134,768 |
| 2017 | $2,305 | $171,158 | $36,390 | $134,768 |
| 2016 | $2,227 | $171,158 | $36,390 | $134,768 |
| 2015 | $2,249 | $162,469 | $40,002 | $122,467 |
| 2014 | $2,249 | $162,469 | $40,002 | $122,467 |
Source: Public Records
Map
Nearby Homes
- 1201 Opal Ln
- 1213 Opal Ln
- 3721 Brightwood Ln
- 110 Rosebud Ln
- 608 Clearfield Dr
- 116 Eastern Teal Dr
- 516 Cove Hollow Dr
- 510 Cove Hollow Dr
- 509 Pebblestone Dr
- 2113 Fletchers Ridge Dr
- 1828 Fletchers Chapel Rd
- 1110 Caswell Way Ct
- 2128 Fletchers Ridge Dr
- 412 Pebblestone Dr
- 2437 Redwood Rd
- 409 Magna Dr
- 4300-4304 Cheek Rd
- 1034 Statler Dr
- 4009 Fiesta Rd
- 1742 Fletchers Chapel Rd
- 1109 Red Crest Ln
- 1111 Red Crest Ln
- 108 Red Bird Dr
- 1108 Red Crest Ln
- 1104 Whispering Oak Ln
- 106 Red Bird Dr
- 1110 Red Crest Ln
- 1106 Whispering Oak Ln
- 1110 Whispering Oak Ln
- 104 Red Bird Dr
- 109 Red Bird Dr
- 107 Red Bird Dr
- 111 Red Bird Dr
- 102 Red Bird Dr
- 105 Red Bird Dr
- 201 Red Bird Dr
- 103 Red Bird Dr
- 1101 Whispering Oak Ln
- 101 Red Bird Dr
- 1105 Whispering Oak Ln
Your Personal Tour Guide
Ask me questions while you tour the home.